2020.08.21
WealthPark CIO Suzuki’s Column – Observe Pre-Owned Property Market from the Newly Released Data

Today, we would like to walk you through the property sales data for pre-owned property released by The Real Estate Transaction Promotion Center on August 11 to together observe the current condition of the market.
TOC
1. Number of Pre-owned Property Transaction
Compared to July 2019, the number of sales in July 2020 the number stays the same in Hokkaido and Osaka but decreased by 4% in Tokyo, 6% in Kanagawa, 5% in Fukuoka, and 5% in Okinawa.
Figure 1: Number of pre-owned property transaction
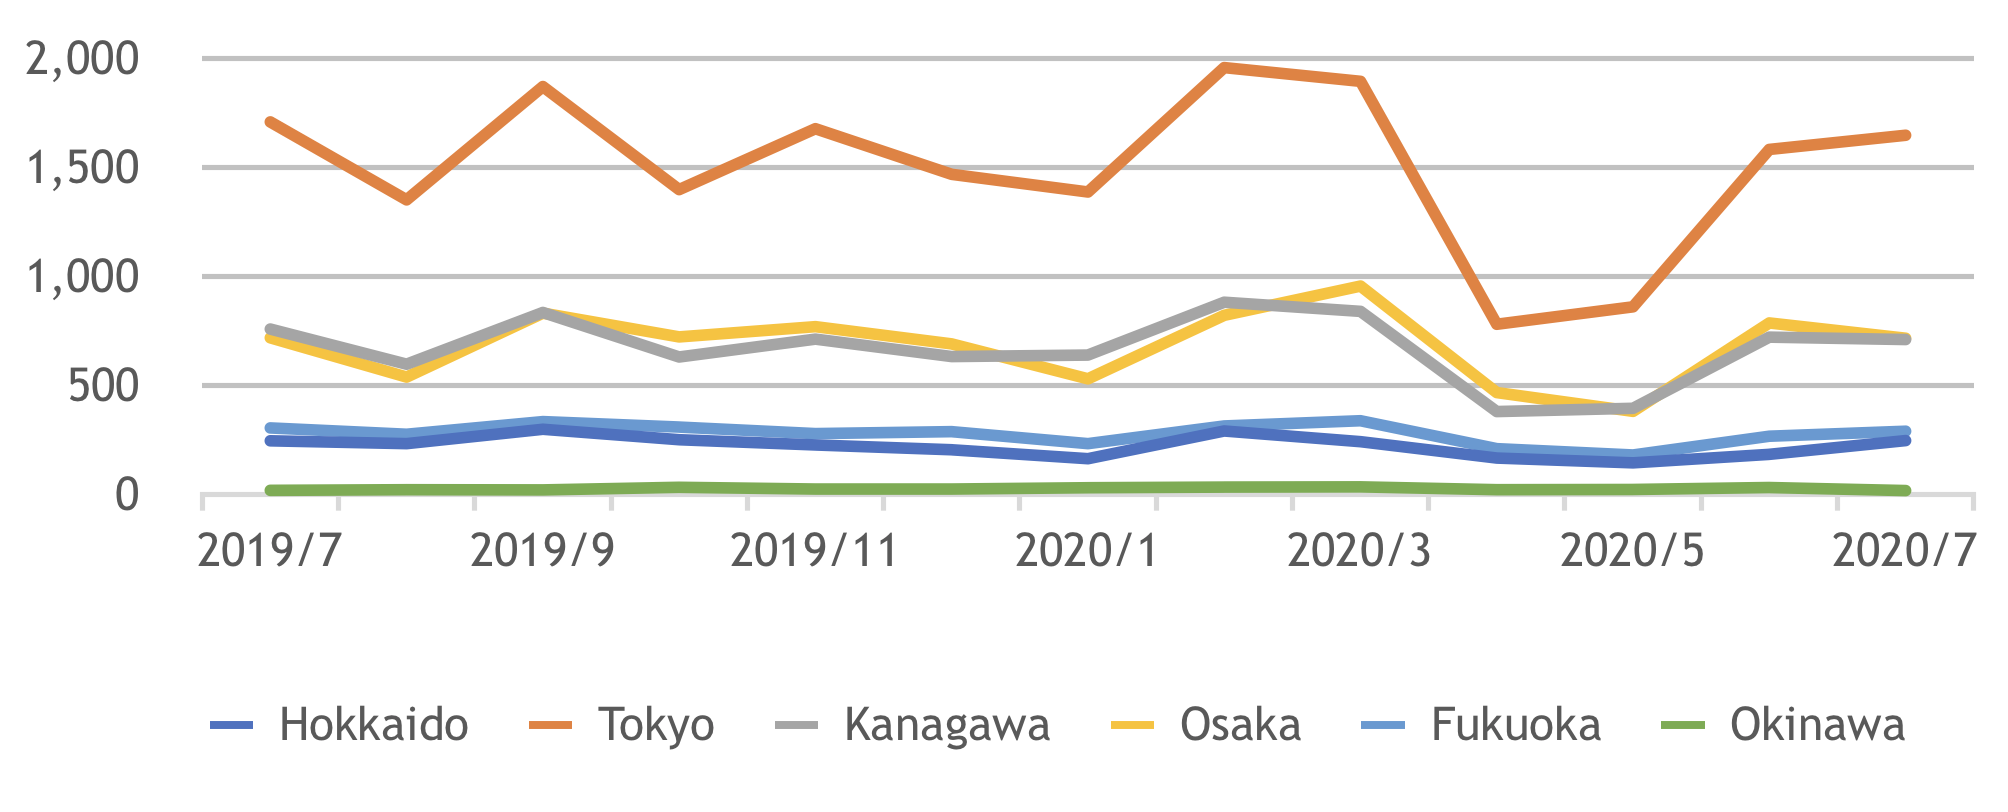
Per the article we launched last month, compared to June 2019, the number of sales in June 2020 decreased by 34% in Hokkaido, 12% in Tokyo, 16% in Kanagawa, and 22% in Fukuoka but increased by 6% in Osaka and 21% in Okinawa. Compared to the double-digit decline in the number of transactions last month, the influence of COVID-19 has softened considerably and the market seems to be recovering.
2. Average price for sold pre-owned properties
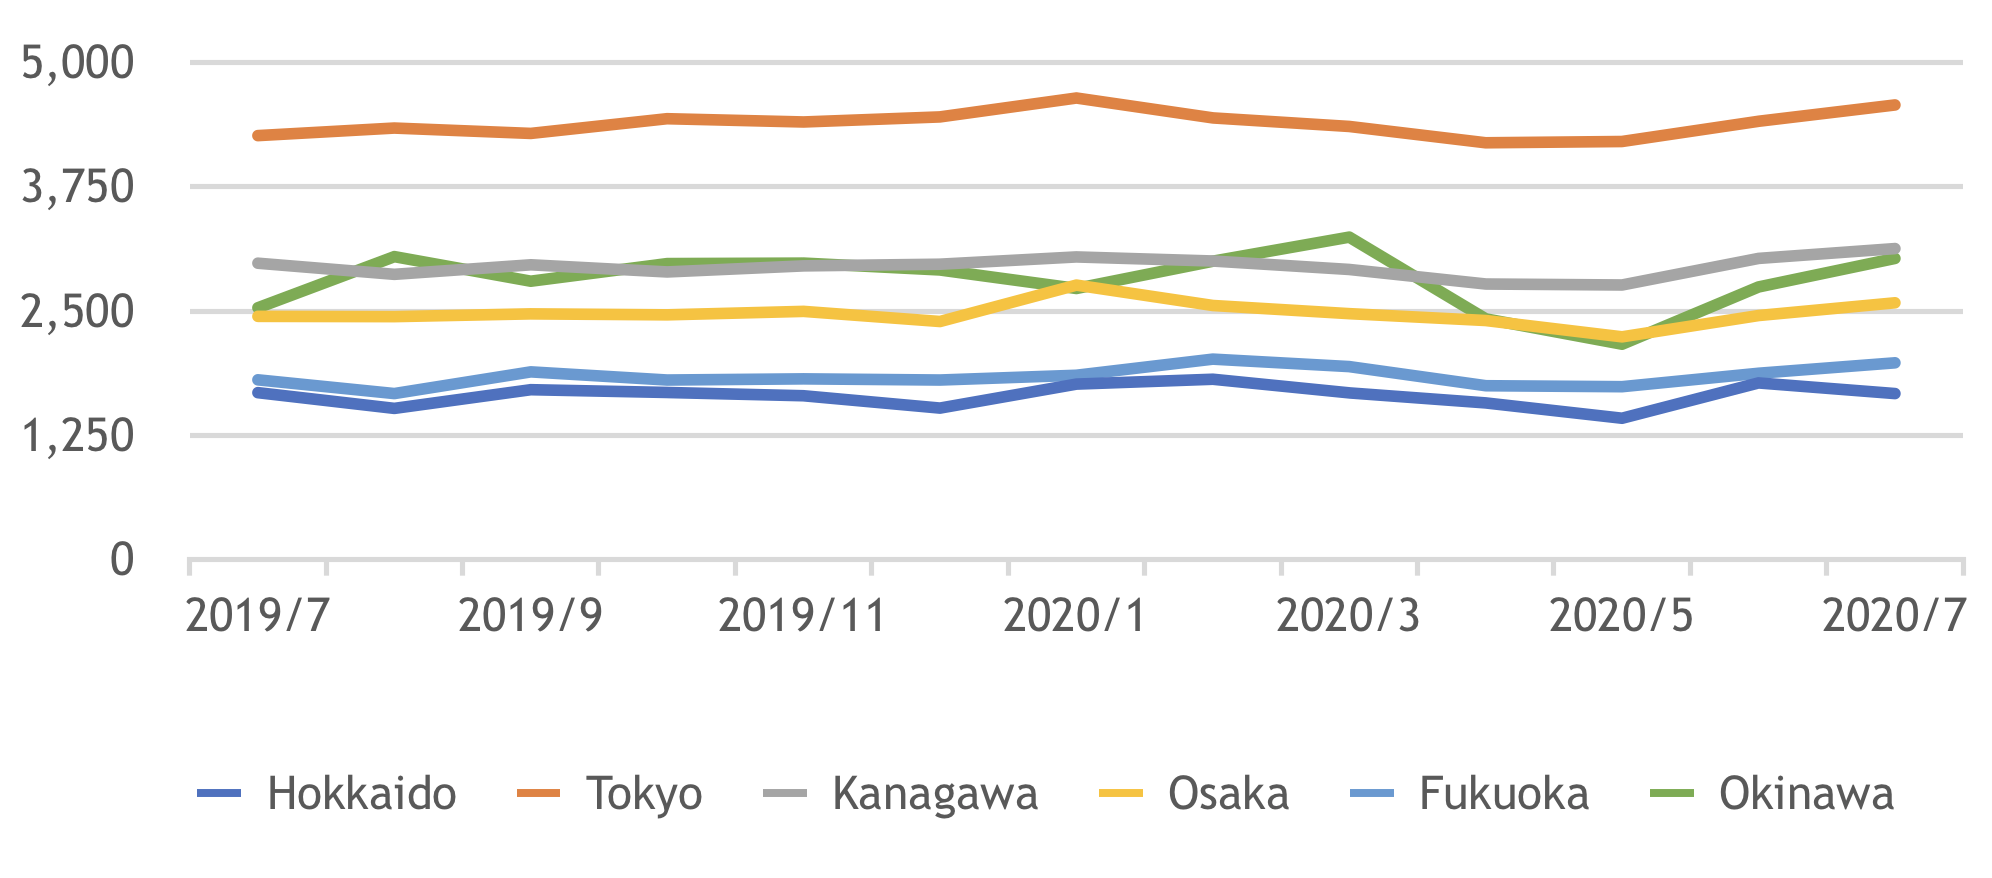
Next, let’s see how average price for sold pre-owned properties fluctuates. In July 2020, the average price for sold pre-owned properties was 16.72 million JPY in Hokkaido (-1% YoY), 45.72 million JPY in Tokyo (+7% YoY), 31.29 million JPY in Kanagawa (+5% YoY), 25.84 million JPY (+6% YoY) in Osaka, 18.76 million JPY in Fukuoka (+9% YoY), and 30.30 million JPY in Okinawa (+20% YoY). Overall to say, the numbers increased year on year. What the reasons can be? Let’s also take a look at the unit price per square meter.
Figure 2: Average price for sold pre-owned properties (Unit: 10,000 JPY)
3. Unit price per ㎡ for sold pre-owned properties
Compared to the unit price per square meter of sold pre-owned properties in July 2019, the unit price in July 2020 increased by 2% in Hokkaido, 6% in Tokyo, 6% in Kanagawa, 4% in Osaka, 6% in Fukuoka, and 11% in Okinawa.
Figure 3: Unit price per square meter of pre-owned property transaction (Unit: 10,000 JPY)
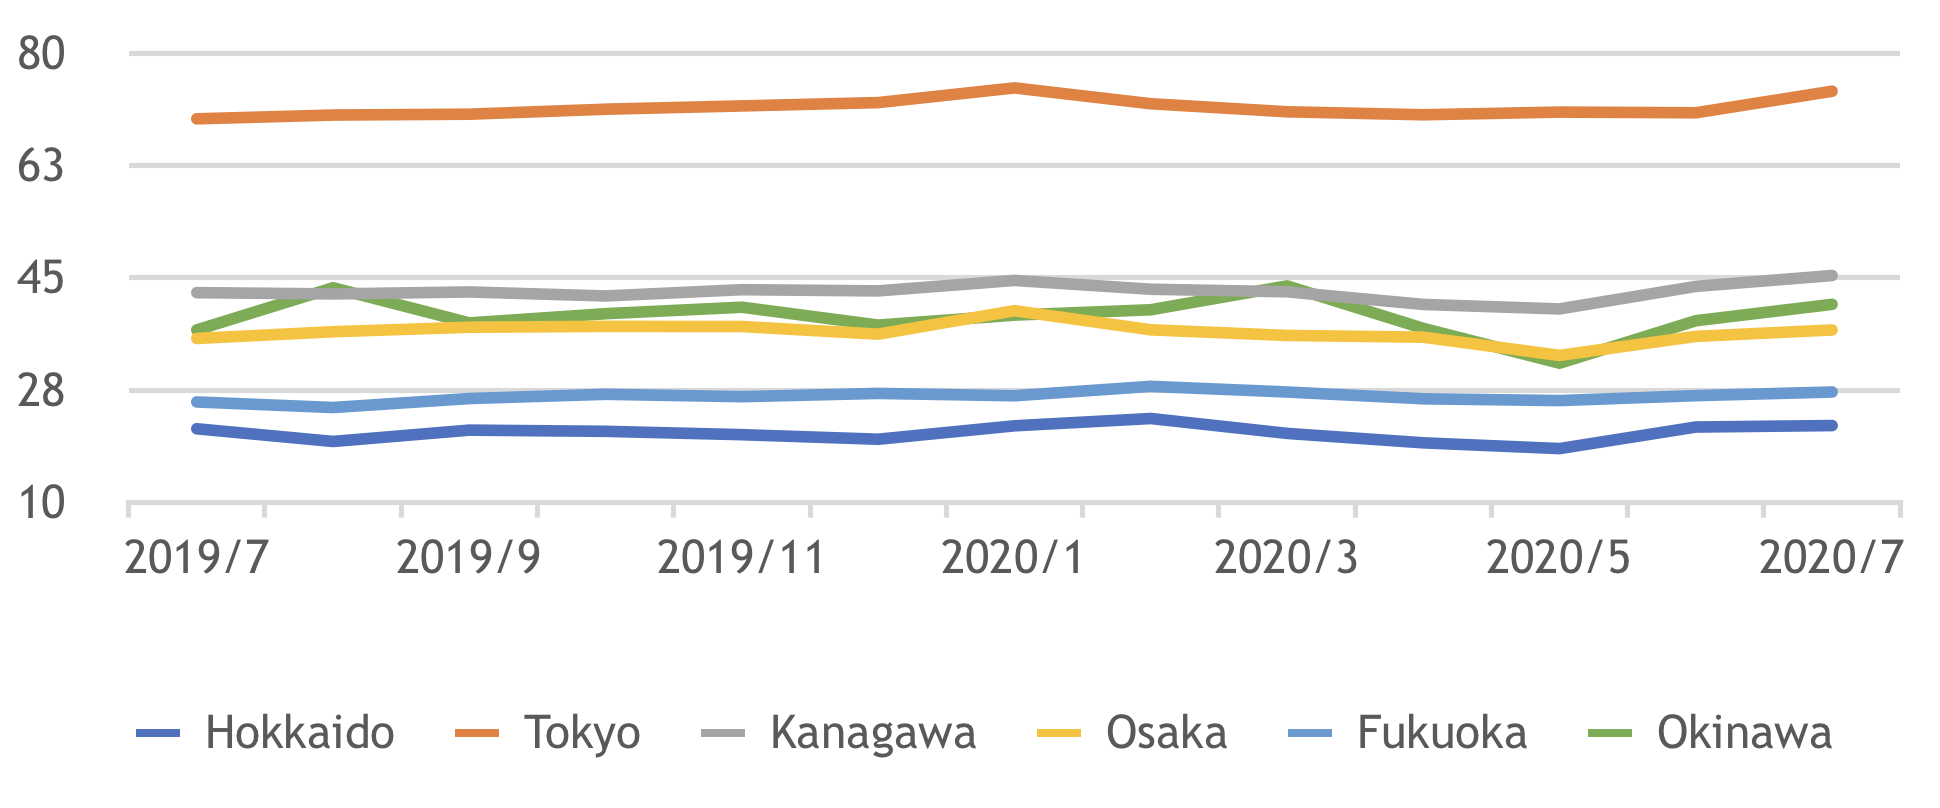
Per mentioned last month, compared to the price in June 2019, the unit price per square meter in June 2020 increased by 1% in Hokkaido, 2% in Tokyo, 2% in Kanagawa, 1% in Osaka, 1% in Fukuoka, and 3% in Okinawa. Judging by the data, it seems that the unit price per square meter is increasing nationwide.
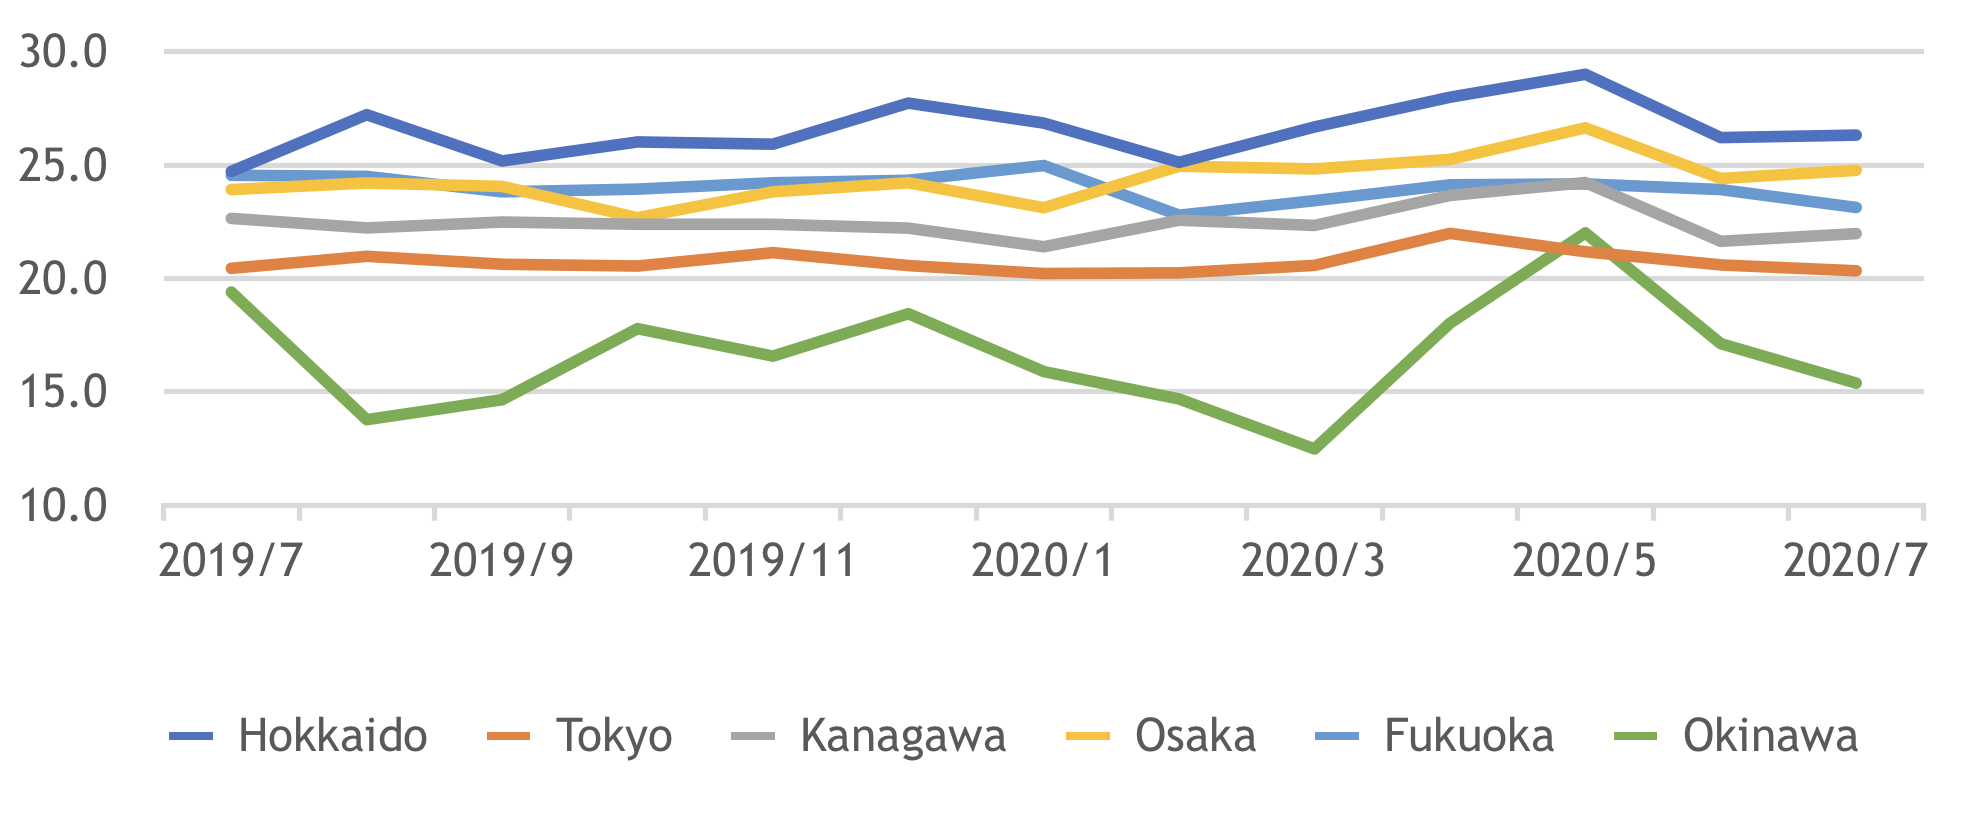
Hypothetically this may be because the properties have been sold this year are relatively new compare to those sold in the previous year. To confirm this point, let’s also take a look at the average age of properties for sale. In Tokyo, the average property age was 20.3 years in July 2020, 1% younger than the average property age 20.5 years in July 2019. In Kanagawa, the average property age was 22.0 years in July 2020, 3% younger than the age of 24.6 years in July 2019. In Fukuoka, the average property age was 23.1 years in July 2020, 6% younger than the average property age 24.6 years in July 2019. In Okinawa, the average property age was 15.4 years in June 2020, 21% younger than the age of 19.4 years in June 2019. This is probably the reason behind the unit price increase.
However, in Tokyo and Kanagawa, even though the sold properties were not relatively new compared to those in the previous year, the unit price per square meter has risen still. It seems like the price stays at a higher level instead of falling to a lower level.
Figure 4: Average age of pre-owned property for sale
The impact of COVID-19 has largely recovered as we can see from the number of transactions in the pre-owned property market. In addition, prices in Hokkaido, Tokyo, Kanagawa, Osaka, Fukuoka, and Okinawa have not shown a downward trend. Especially in Tokyo and Kanagawa, even though the properties are not particularly new, the price is still rising, which is quite impressed to us.
WealthPark will keep paying close attention to the market and provide you with the most recent analysis and insights.
[Disclaimer]
This article contains the author’s personal opinions, and if you have any questions or concerns about this article, please contact the author for further information.
This article is not intended as a solicitation or recommendation to buy or sell any kind of investment, nor is it a suggestion or guarantee of any investment results or investment returns. The Company shall not be liable for any loss or damage caused based on this article.