2020.08.28
WealthPark CIO Suzuki’s Column – Market Overview of New Properties – July 2020
Same as last month, I will be providing an update to the market overview of new properties using data released by the Institute of Real Estate Economics on August 20th, 2020. We will continue to investigate the number of new properties listed vs number of properties sold, changes in selling prices, and various price bands in 5 distinct regions (central Tokyo, Tokyo suburbs, Kanagawa Prefecture, Osaka City, Osaka Prefecture).
TOC
1. Central Tokyo
a. New Properties Sales
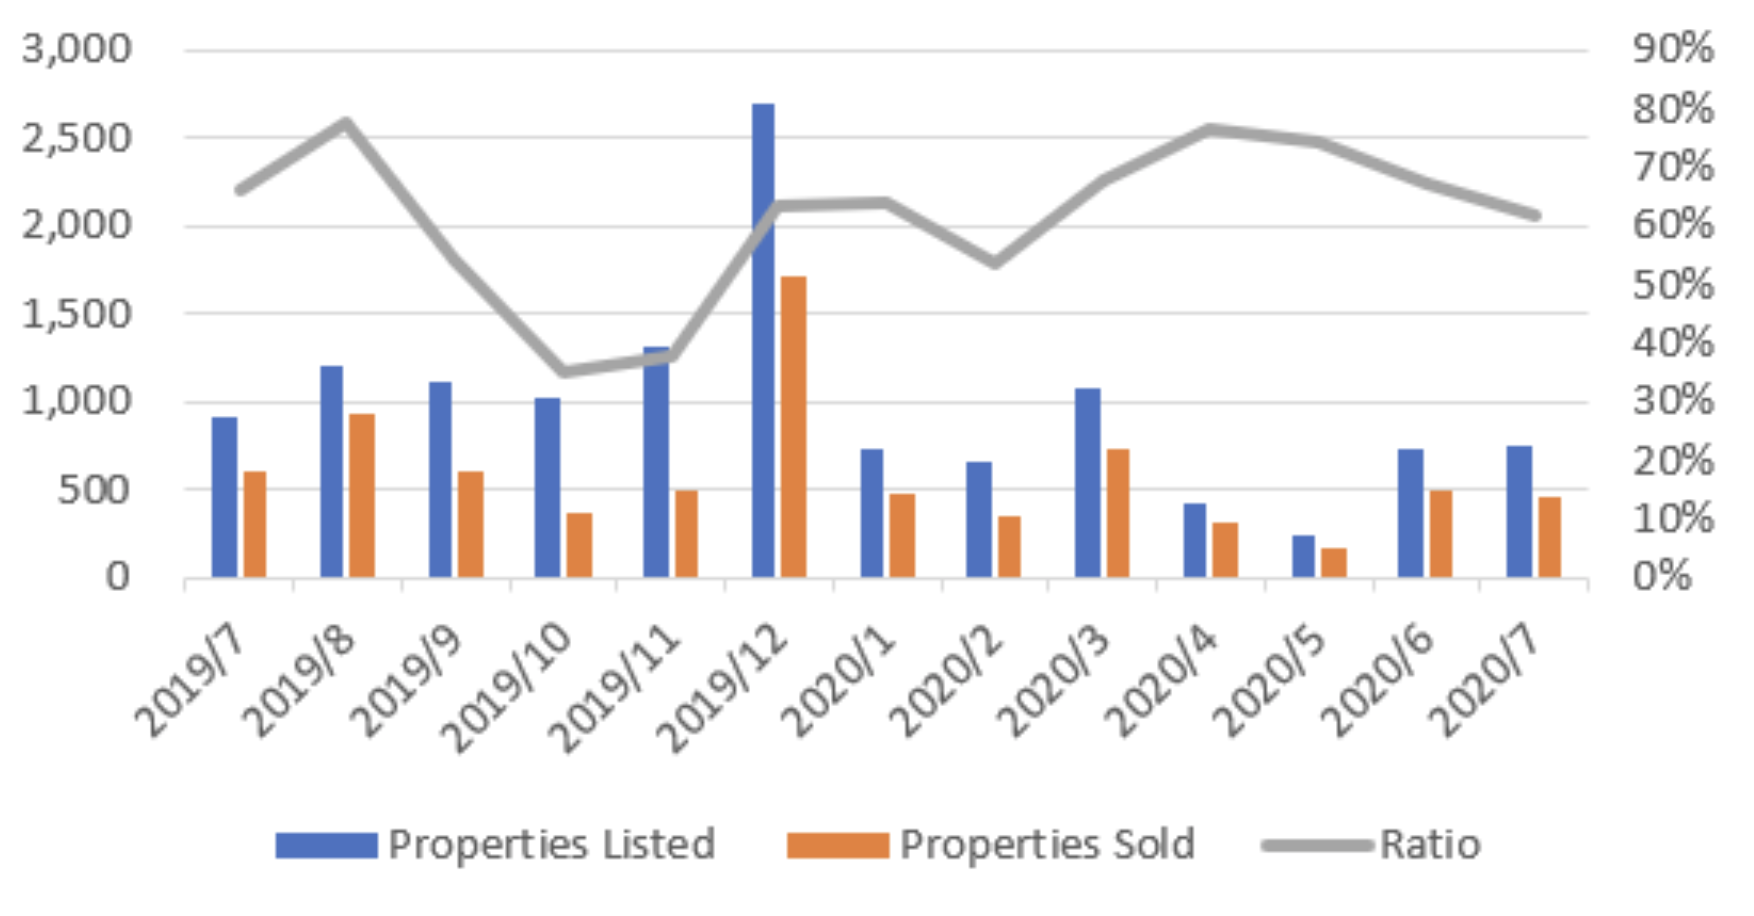
During the past year, the average number of new homes in the heart of Tokyo was approximately 1000 a month. Under the influence of covid-19, the sales volume in April and May 2020 was less than 500, but in July it grew to 744, which was a 19% decline from the same time last year. The ratio between properties sold to listings available in the month exceeded 60% (see Figure 1-1).
Figure 1-1 Central Tokyo New Properties Supply and Demand
b. New Properties Price
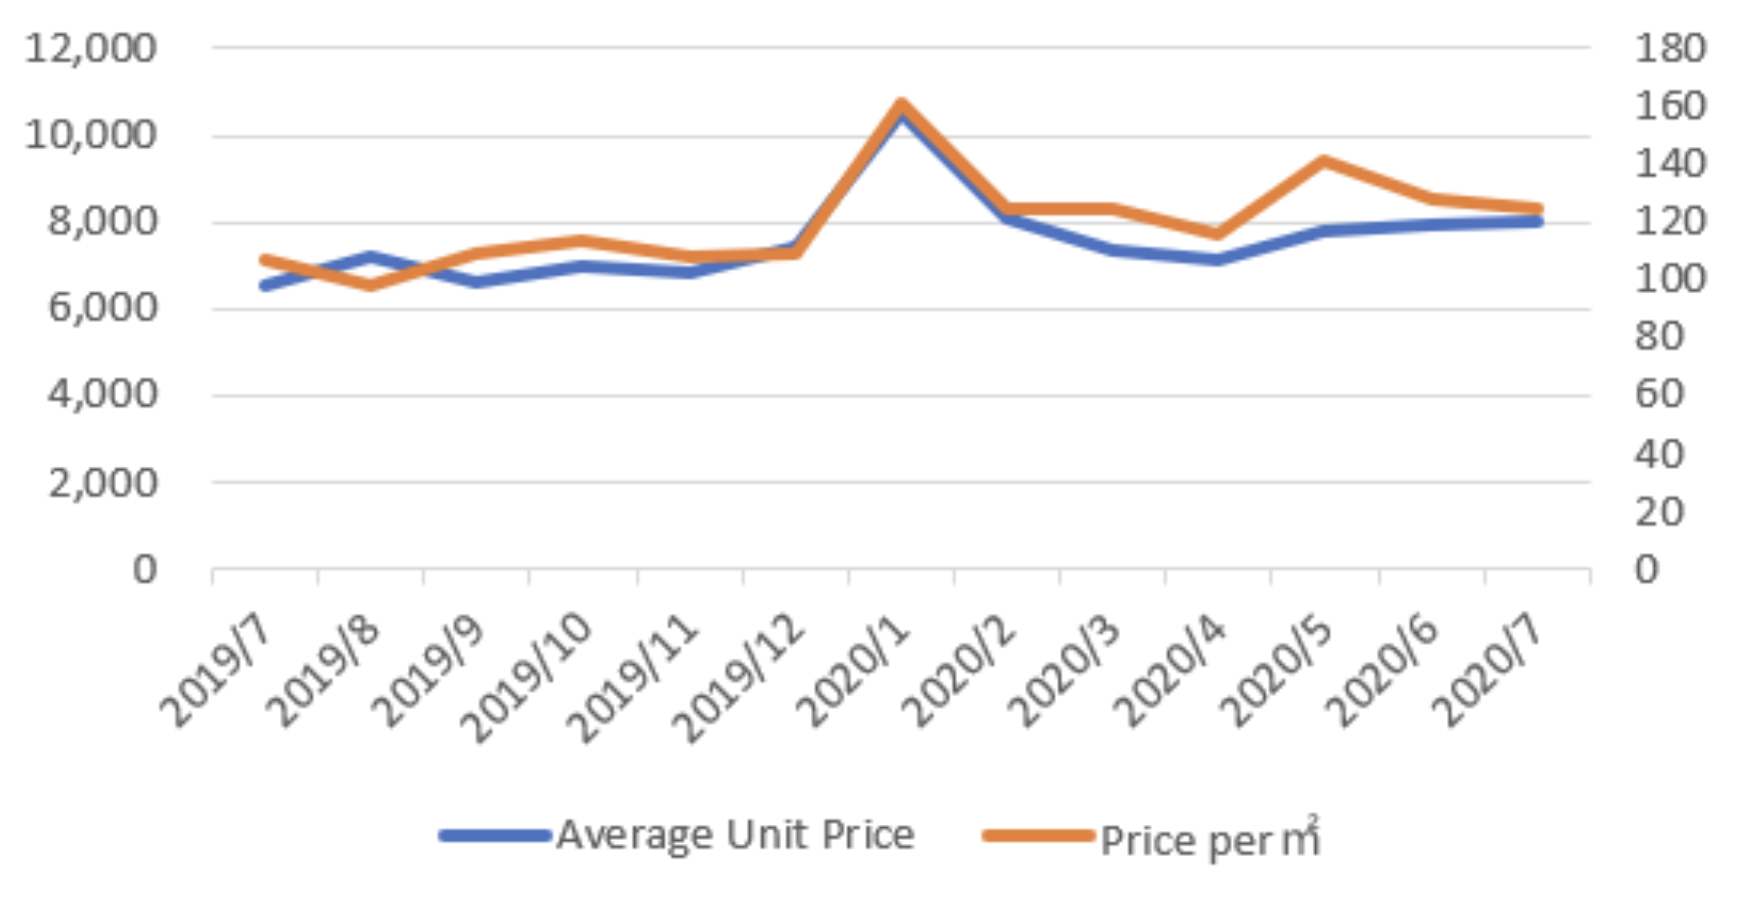
The average price of a new home in Tokyo’s suburbs was about JPY 75 million last year and JPY 80.31 million in July 2020, an increase of 23% compared to the same period last year. In July 2020, it will be 1.25 million yen, an increase of 17% compared to the same period last year. It is clear that there is an increase compared to the same period last year, but it is almost the same as the previous month. (Figure 1-2)
Figure 1-2 Central Tokyo Average Unit Price and Price per Squared Meter
c. Price Bands
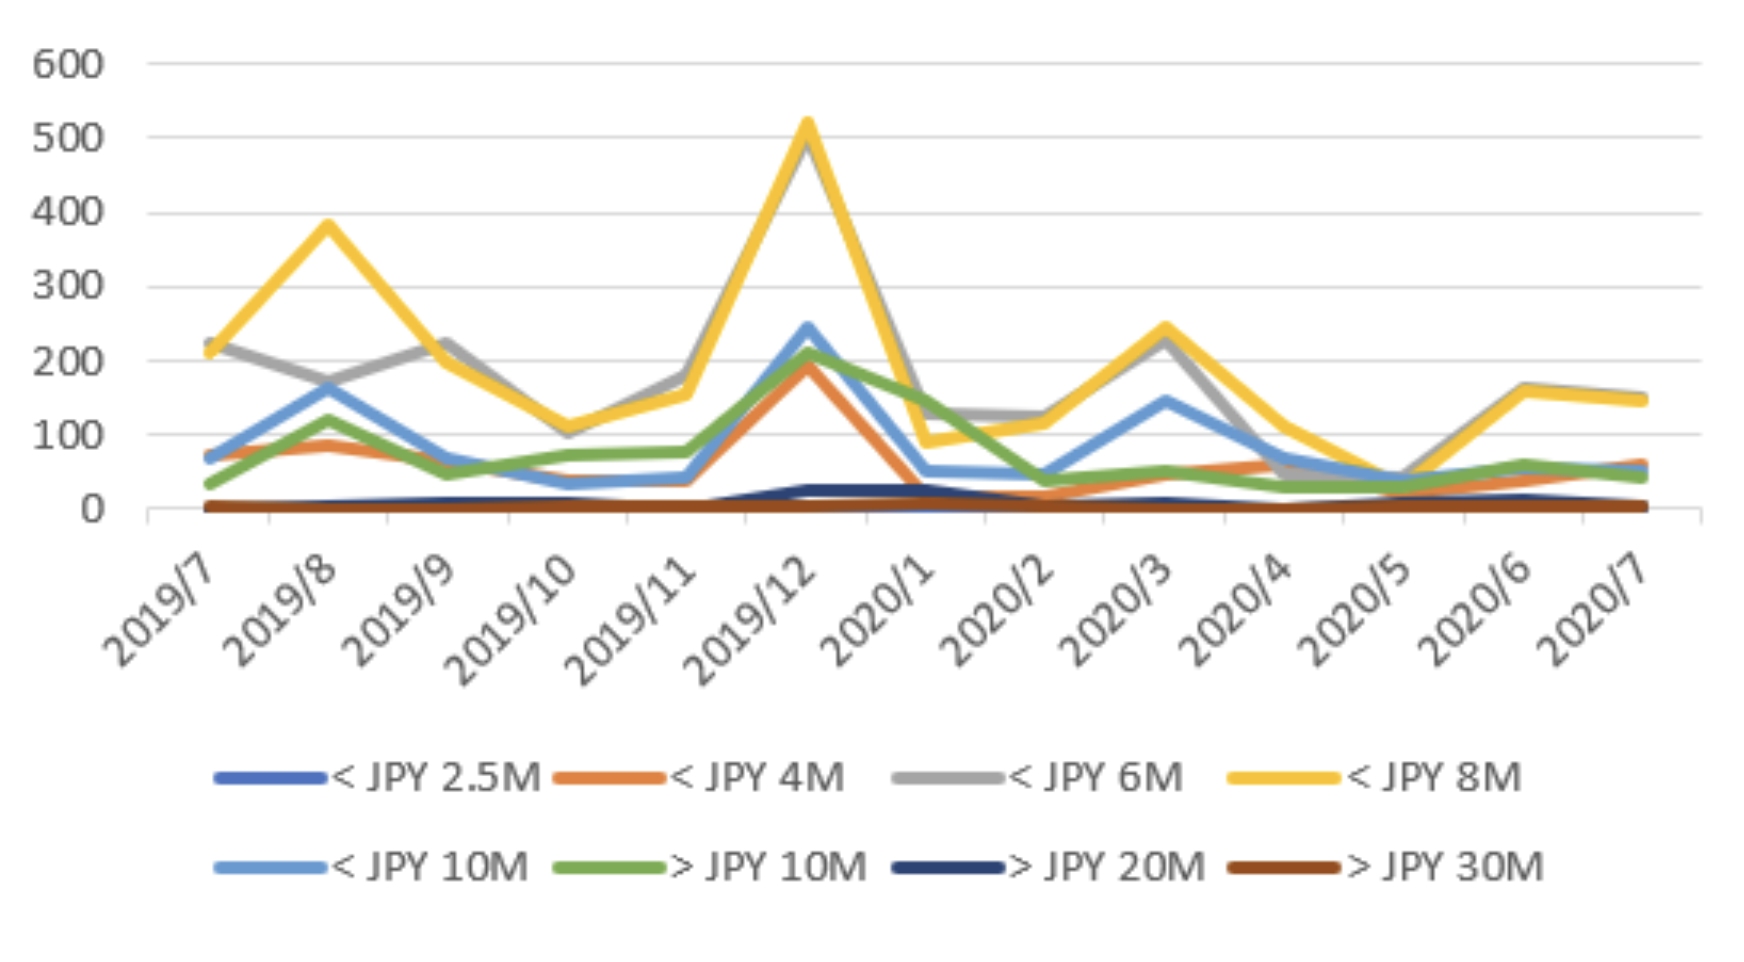
In July 2020, the number of new home price contracts signed in Central Tokyo increased significantly compared to the same period of last year, with contracts of JPY 80 million+ but less than JPY 100 million signed. (Figures 1-3)
Figure 1-3 Central Tokyo Price Bands
2. Tokyo Suburbs
a. New Properties Sales
The sales volume of new homes in Tokyo’s suburbs averaged 176 units per month last year. Under the influence of Covid-19, it fell to 50 during April and May 2020 but returned to 266 in July and grew 42% over the same period last year. Although the transaction ratio in the month of opening sales was only about 50%, because the number of sales was also higher than last year, the relative transaction volume was also quite large.
Picture 2-1 Tokyo Suburbs New Properties Supply and Demand

b. New Properties Price
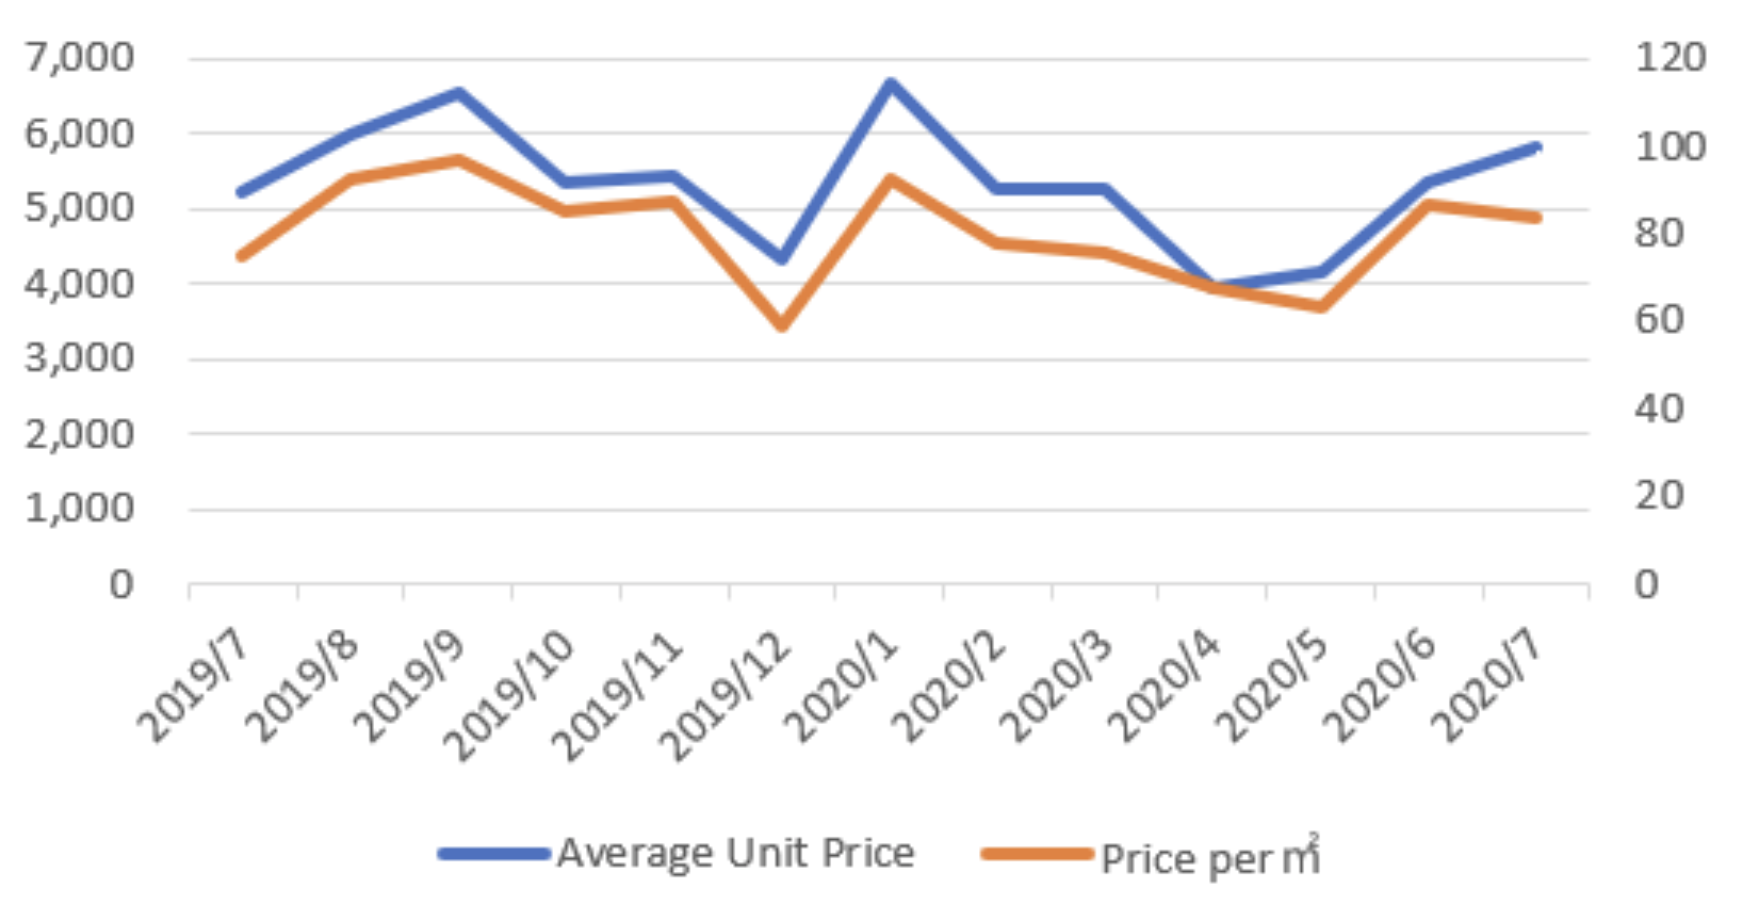
Last year, the average price of a new property in Tokyo’s suburb was about JPY 53 million. July 2020 showed an increase of 12% (compared with last year) as it was JPY 58.14 million. The average unit price of square meters in the past year was JPY 800,000, and in July 2020 it was JPY 840,000, an increase of 12% compared to the same period last year.
Picture 2-2 Tokyo Suburbs Average Unit Price and Price per Squared Meter
c. Price Bands
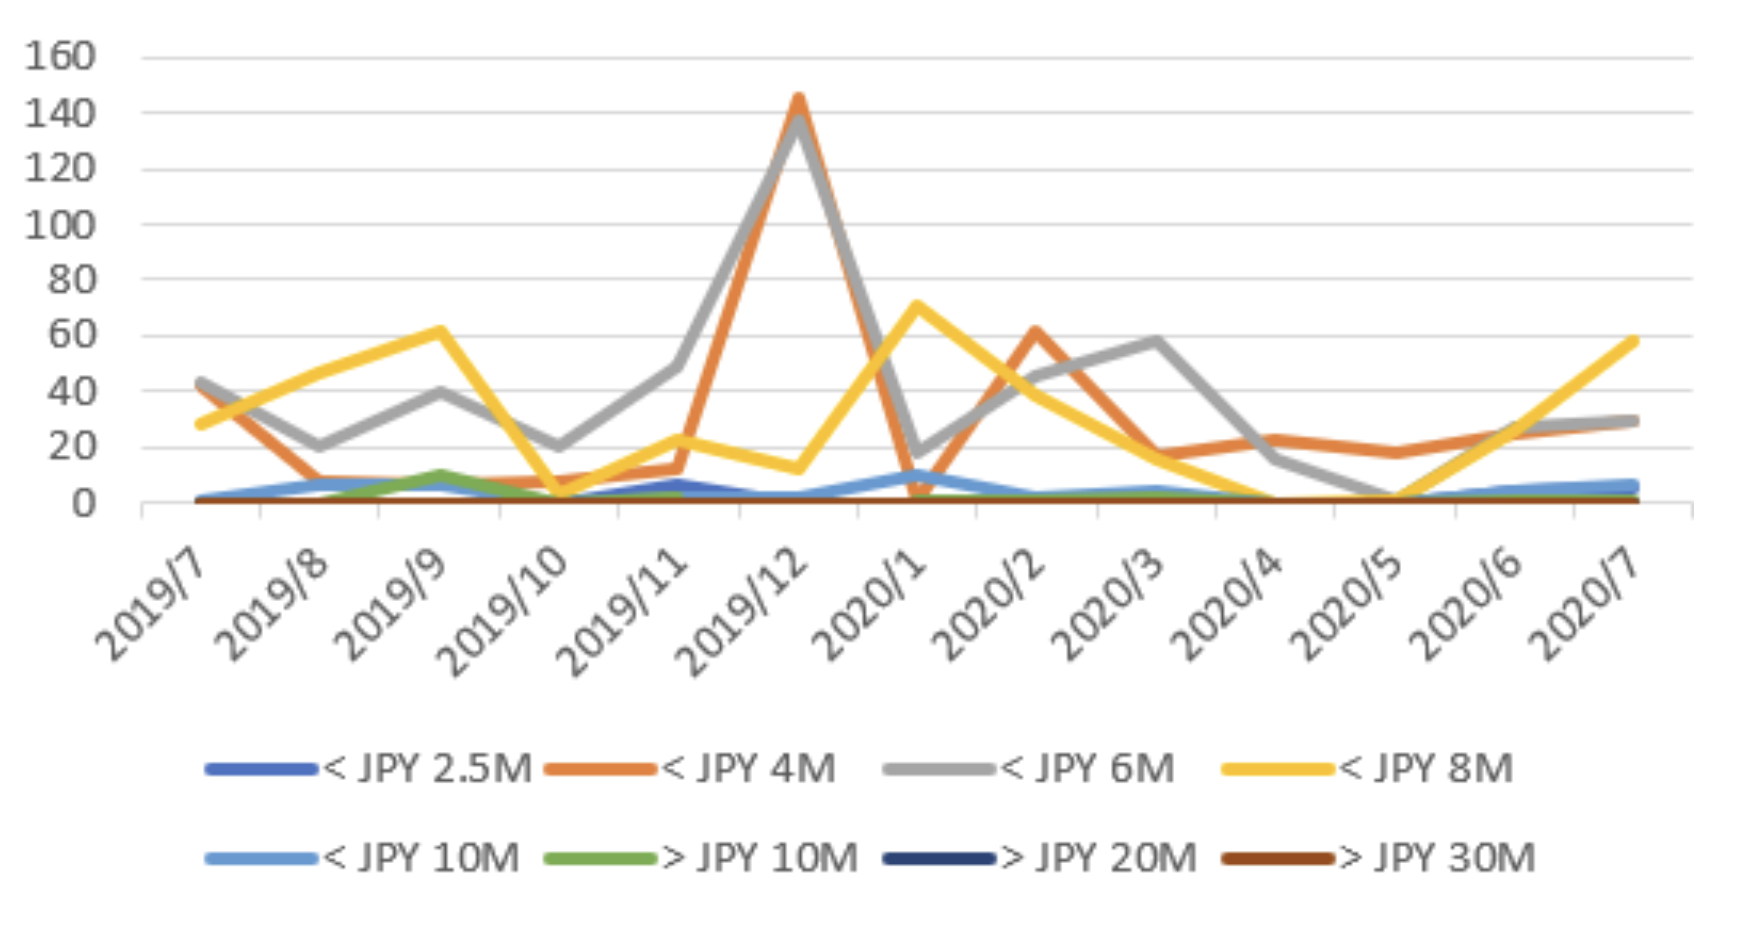
Looking at the price of new houses in the suburbs of Tokyo, the highest band is between JPY 25 million and JPY 60 million. However, in July 2020, compared with the same period last year, the number of contracts with more than JPY 60 million and less than JPY 80 million increased.
Figure 2-3 Tokyo Suburbs Price Bands
3. Kanagawa Prefecture
a. New Properties Sales
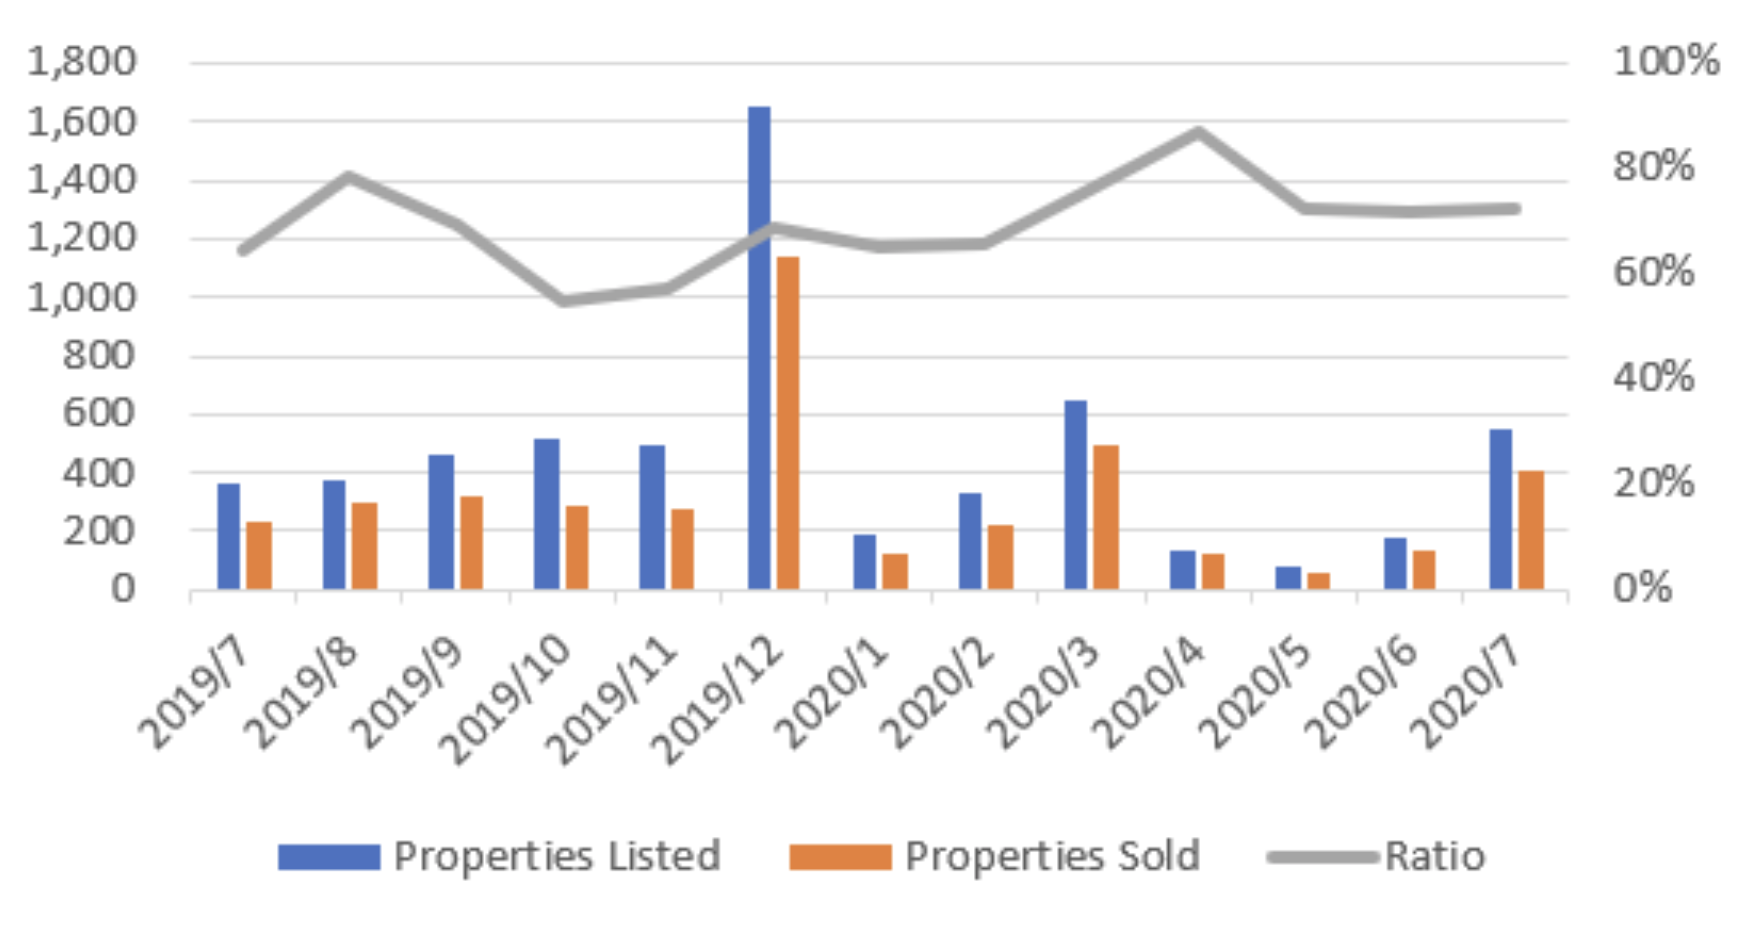
In the past year, the Kanagawa Prefecture has launched an average of about 460 new properties every month. Due to the pandemic, it dropped to 150 in April and May 2020 respectively. Although there were not many in June, it returned to 544 households in July, an increase of 53% compared with the same period last year. The ratio at the month of the start of the sale exceeded 70%.
Figure 3-1 Kanagawa Prefecture New Properties Supply and Demand
b. New Properties Price
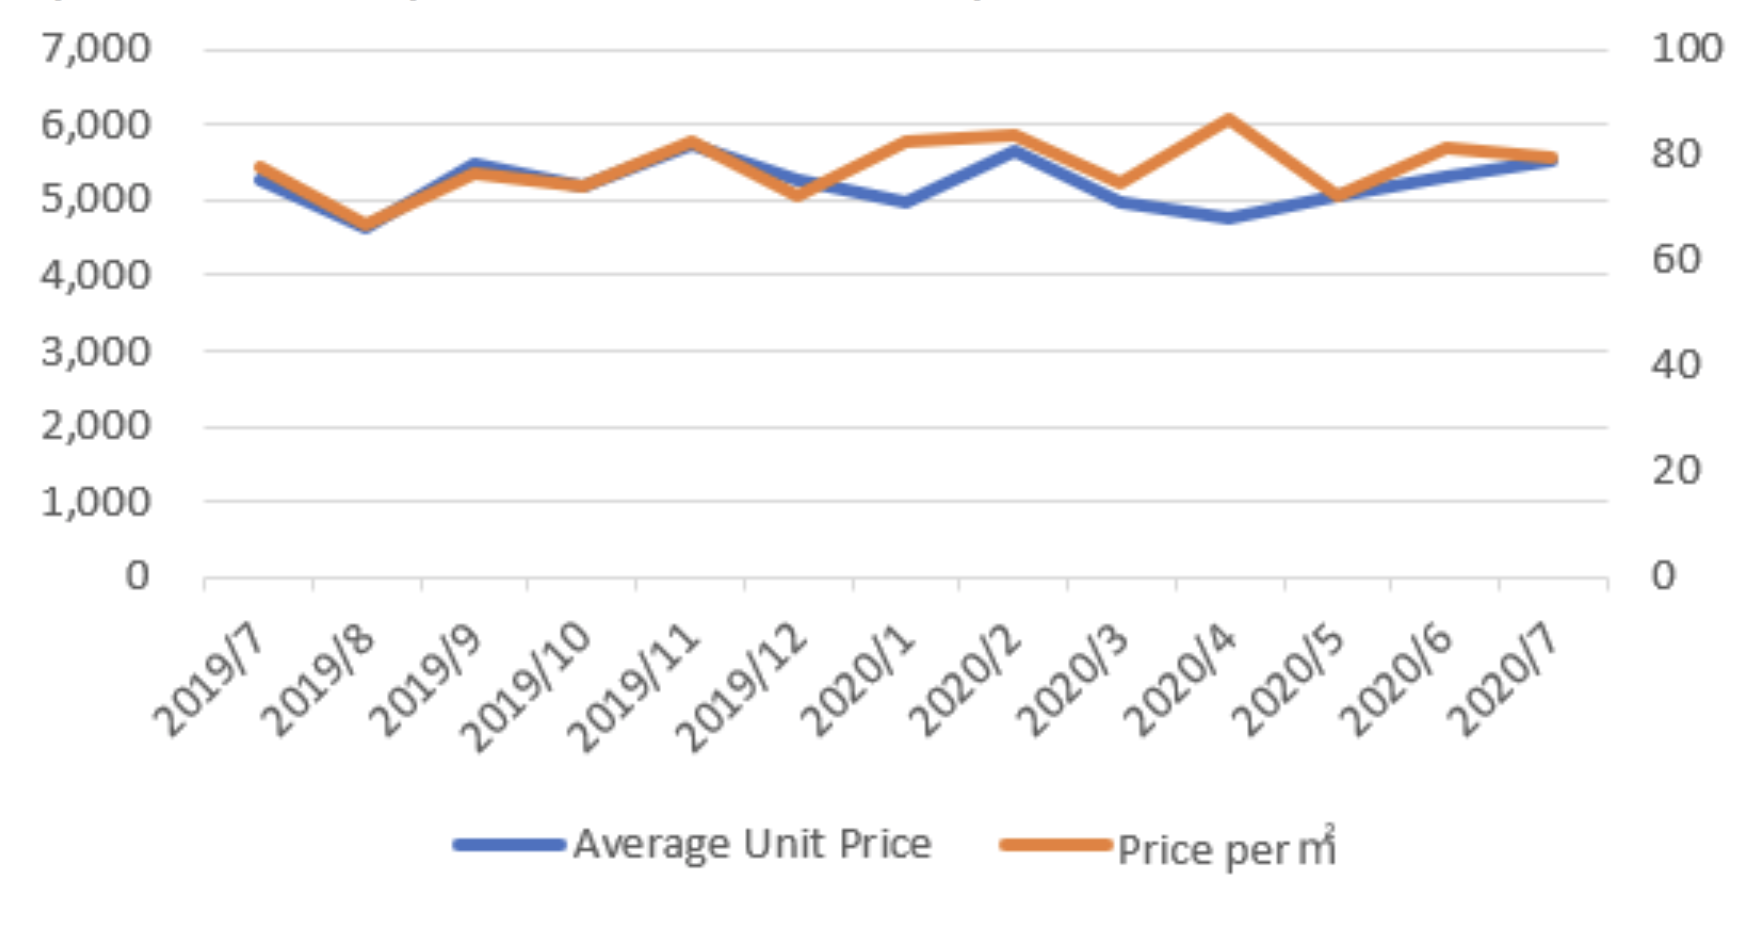
Last year, the average price of a new house in Kanagawa was around JPY 52 million. In July 2020, it was JPY 55.38 million, an increase of 5% compared to the same period last year. The average unit price per square meter was JPY 800,000 last year, and it was JPY 790,000 in July 2020, an increase of 2%.
Figure 3-2 Kanagawa Prefecture Average Unit Price and Price per Squared Meter
c. Price Bands
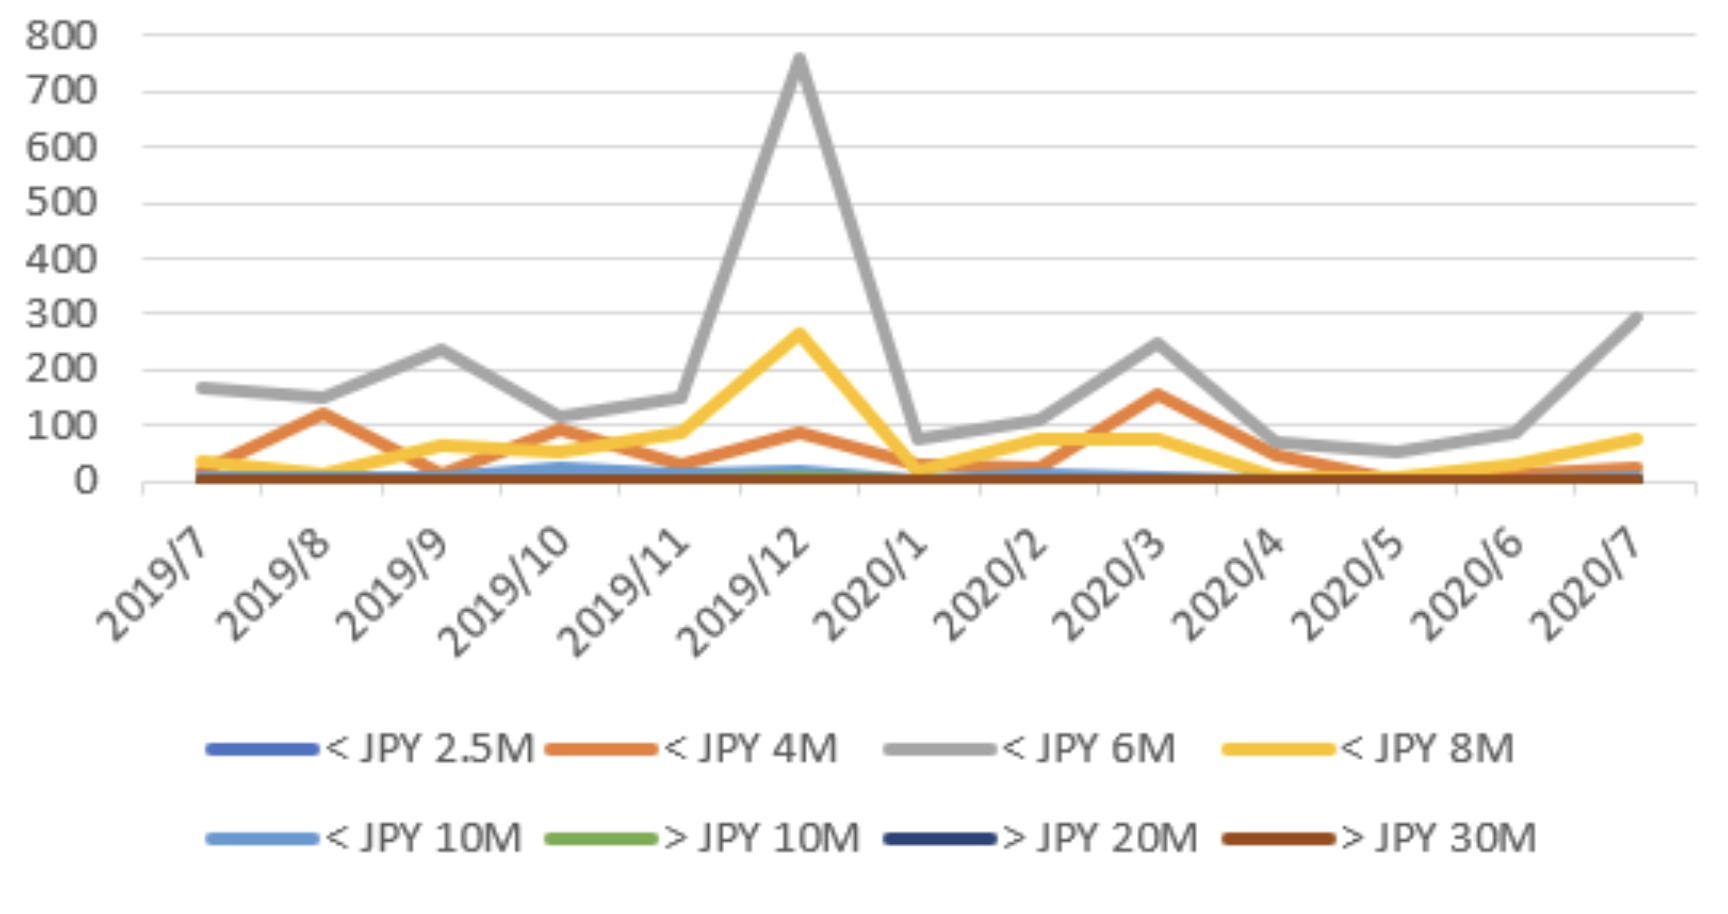
Looking at the contract price of new properties in Kanagawa, the band between JPY 40 million and JPY 60 million is the largest. In July 2020 this price band has increased considerably.
Figure 3-3 Kanagawa Prefecture Price Bands
4. Osaka City
a. New Properties Sales
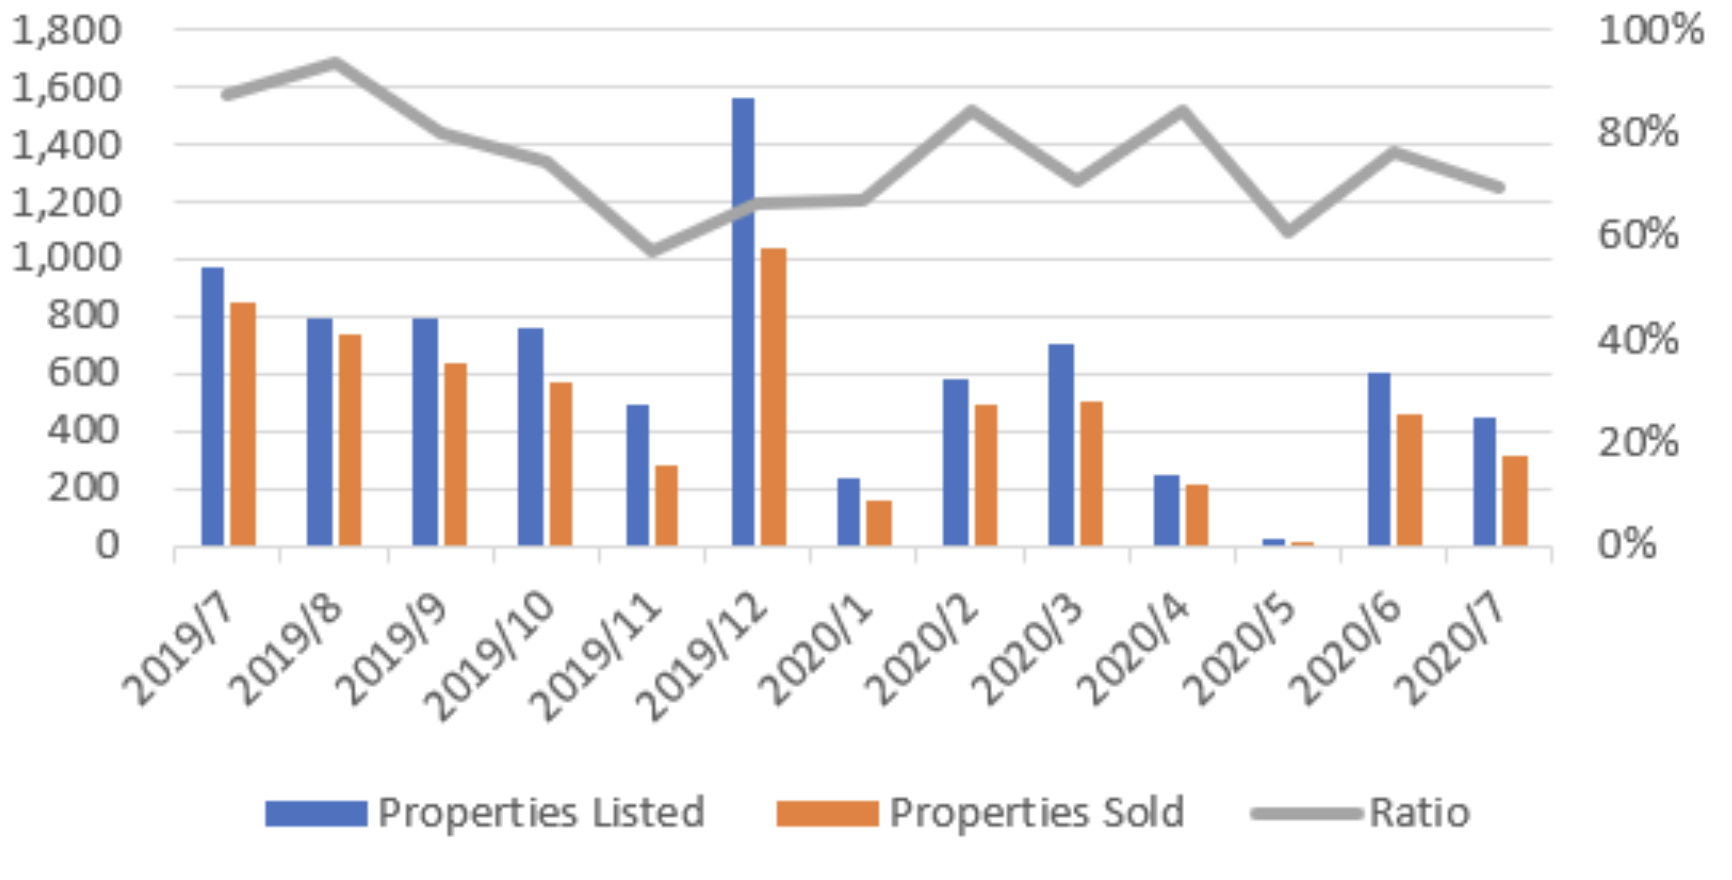
In the past year, Osaka City launched approximately 635 new properties every month. Due to effects of the pandemic, it dropped to 250 in April and May 2020. However, there were 454 new properties in July, a 53% decrease compared to 970 in the previous year. There is still some way to recover. However, the signing rate in the month of the launch was about 70%.
Figure 4-1 Osaka City New Properties Supply and Demand
b. New Properties Price
In the past year, the average price of a new properties in Osaka City was around JPY 37 million, and the average price in July 2020 was JPY 52.05 million, an increase of 4% over the same period last year. The average unit price per square meter in the past year was 800,000 yen, which is the same level as Tokyo suburbs and Kanagawa Prefecture, but it was JPY 960,000 in July 2020, an increase of 3% over the same period last year.
Figure 4-2 Osaka City Average Unit Price and Price per Squared Meter
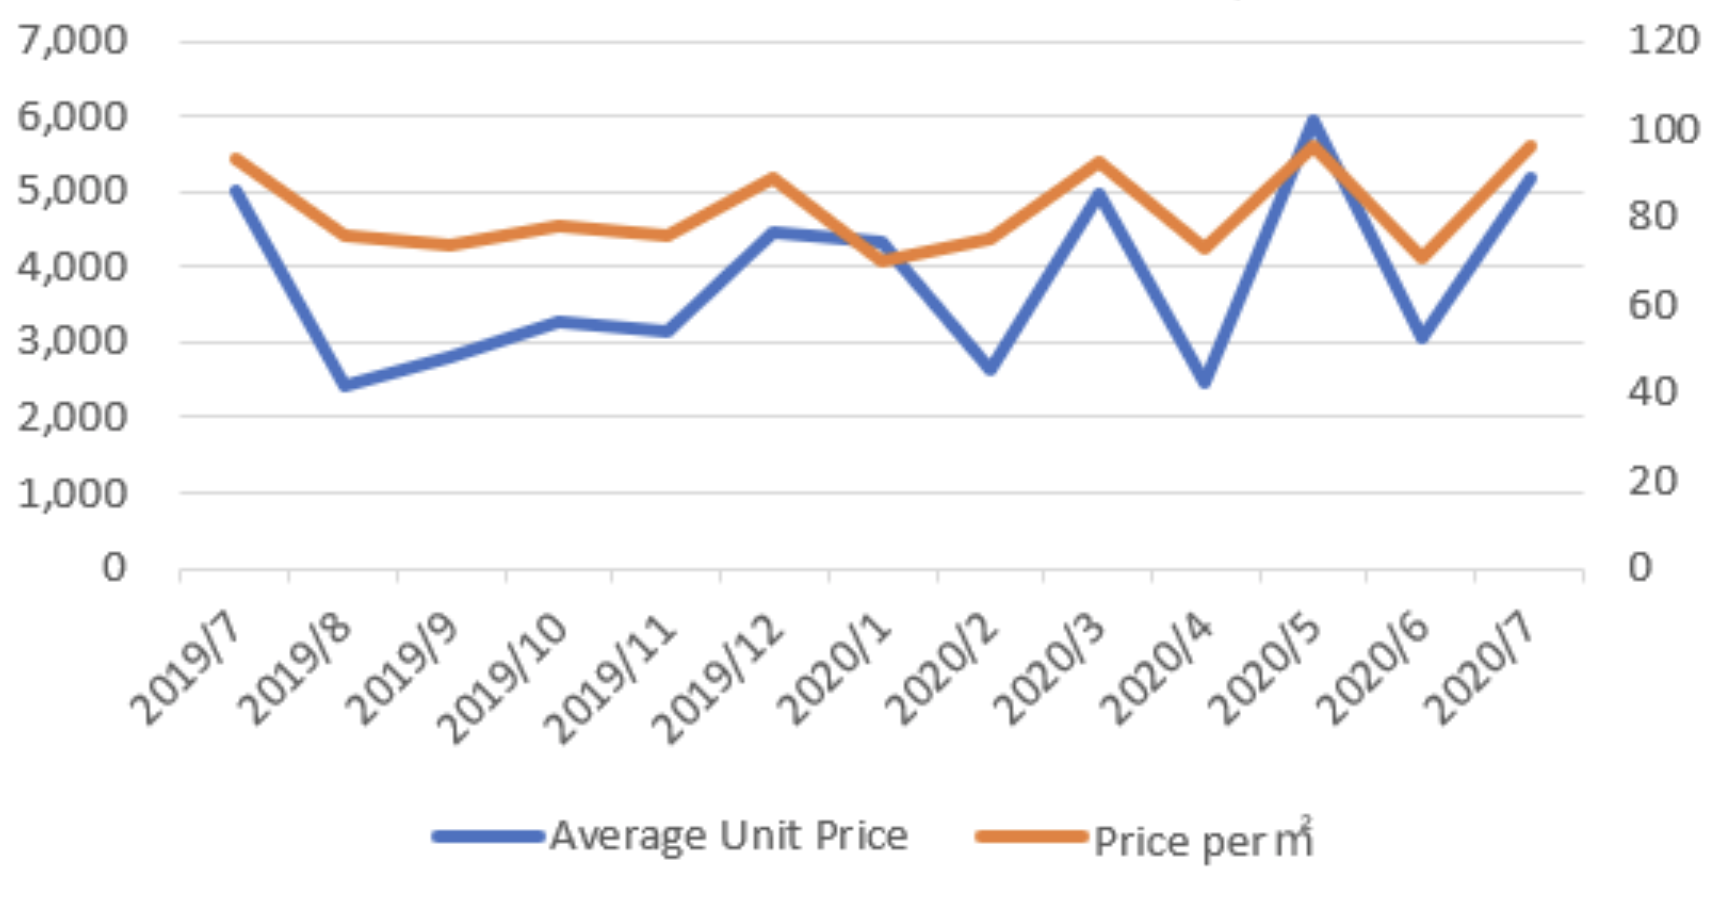
According to data from the Institute of Real Estate Economics, the Kinki region is different from the Central Tokyo, Tokyo suburbs, and the Kanagawa Prefecture. The reason for the large monthly changes in average price and unit price per square meter is that the market is small and the influence of a whole building is great, and the information also includes investment apartments (relatively small suites).
c. Price Bands
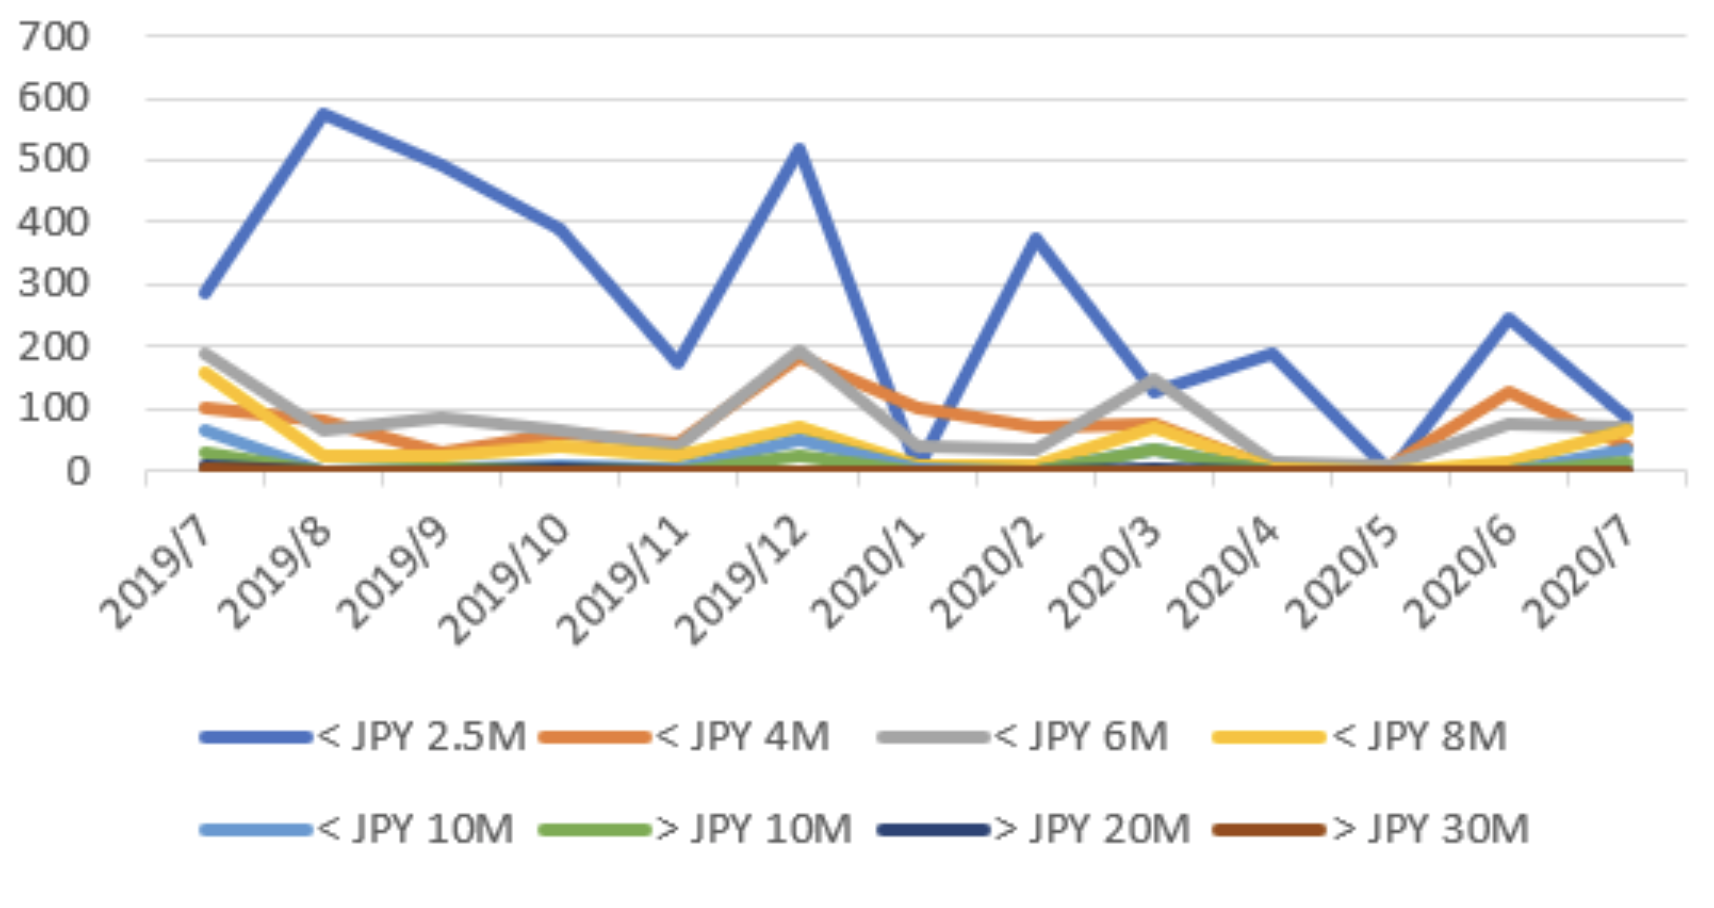
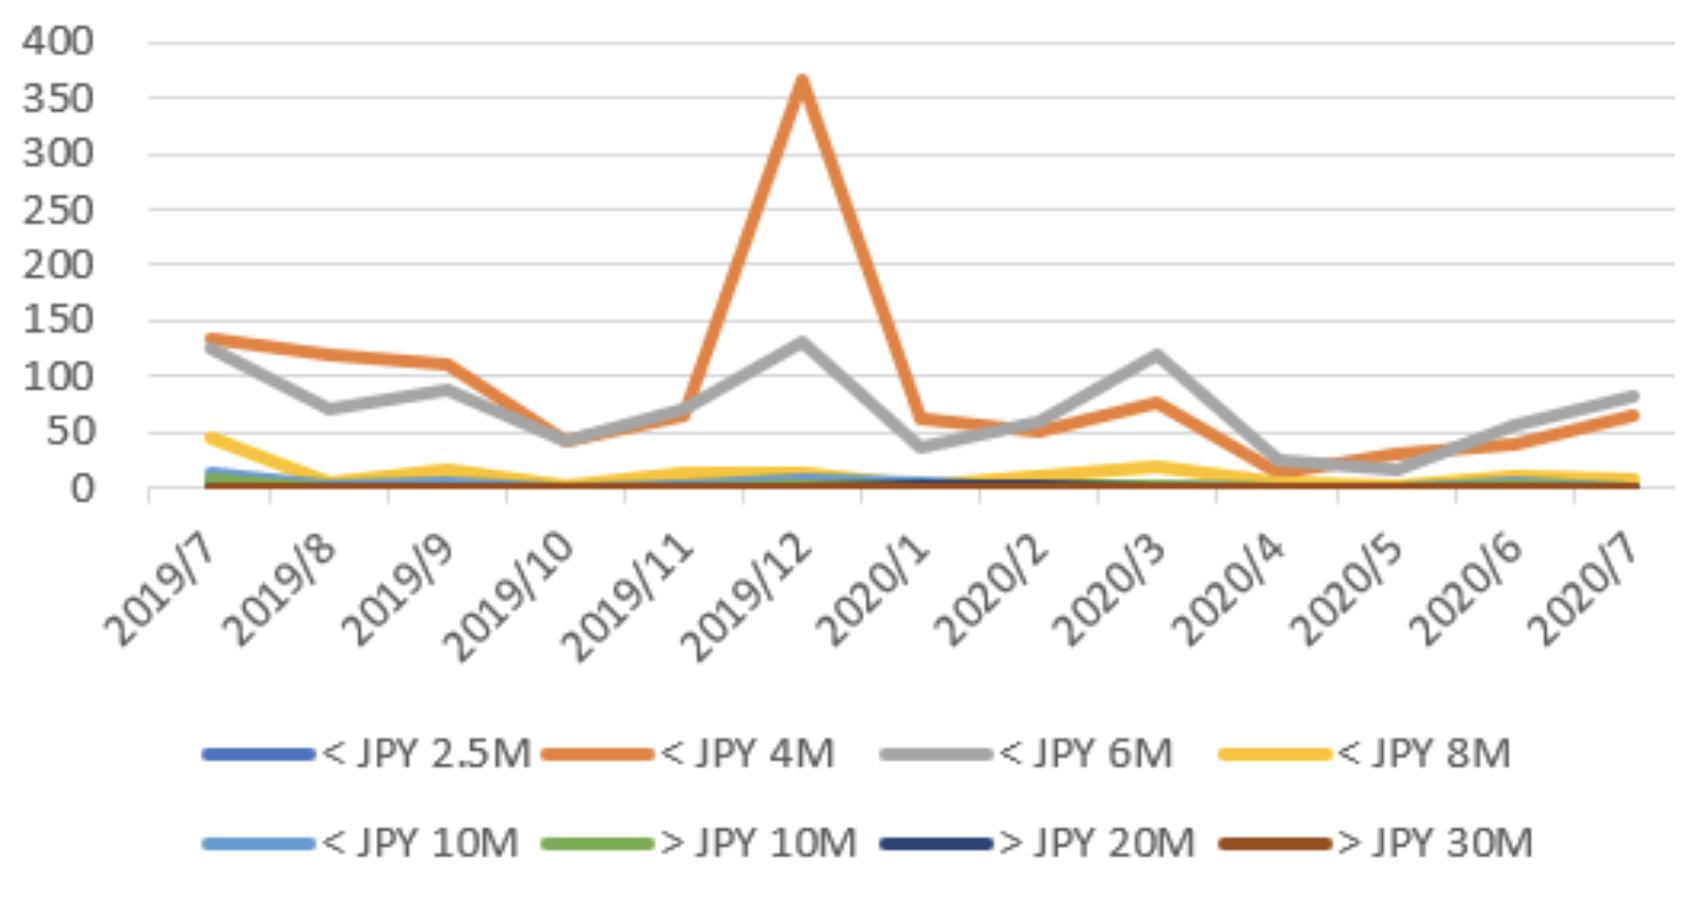
From the perspective of the contract price of new properties in Osaka City, the overwhelming majority is below JPY 25 million, followed by JPY 25 million or more and JPY 60 million or less. In July 2020, it was also JPY 25 million or less. There are also many items that are less than JPY 60 million and more than JPY 60 million and less than JPY 80 million.
Figure 4-3 Osaka City Price Bands
5. Osaka Prefecture
a. New Properties Sales
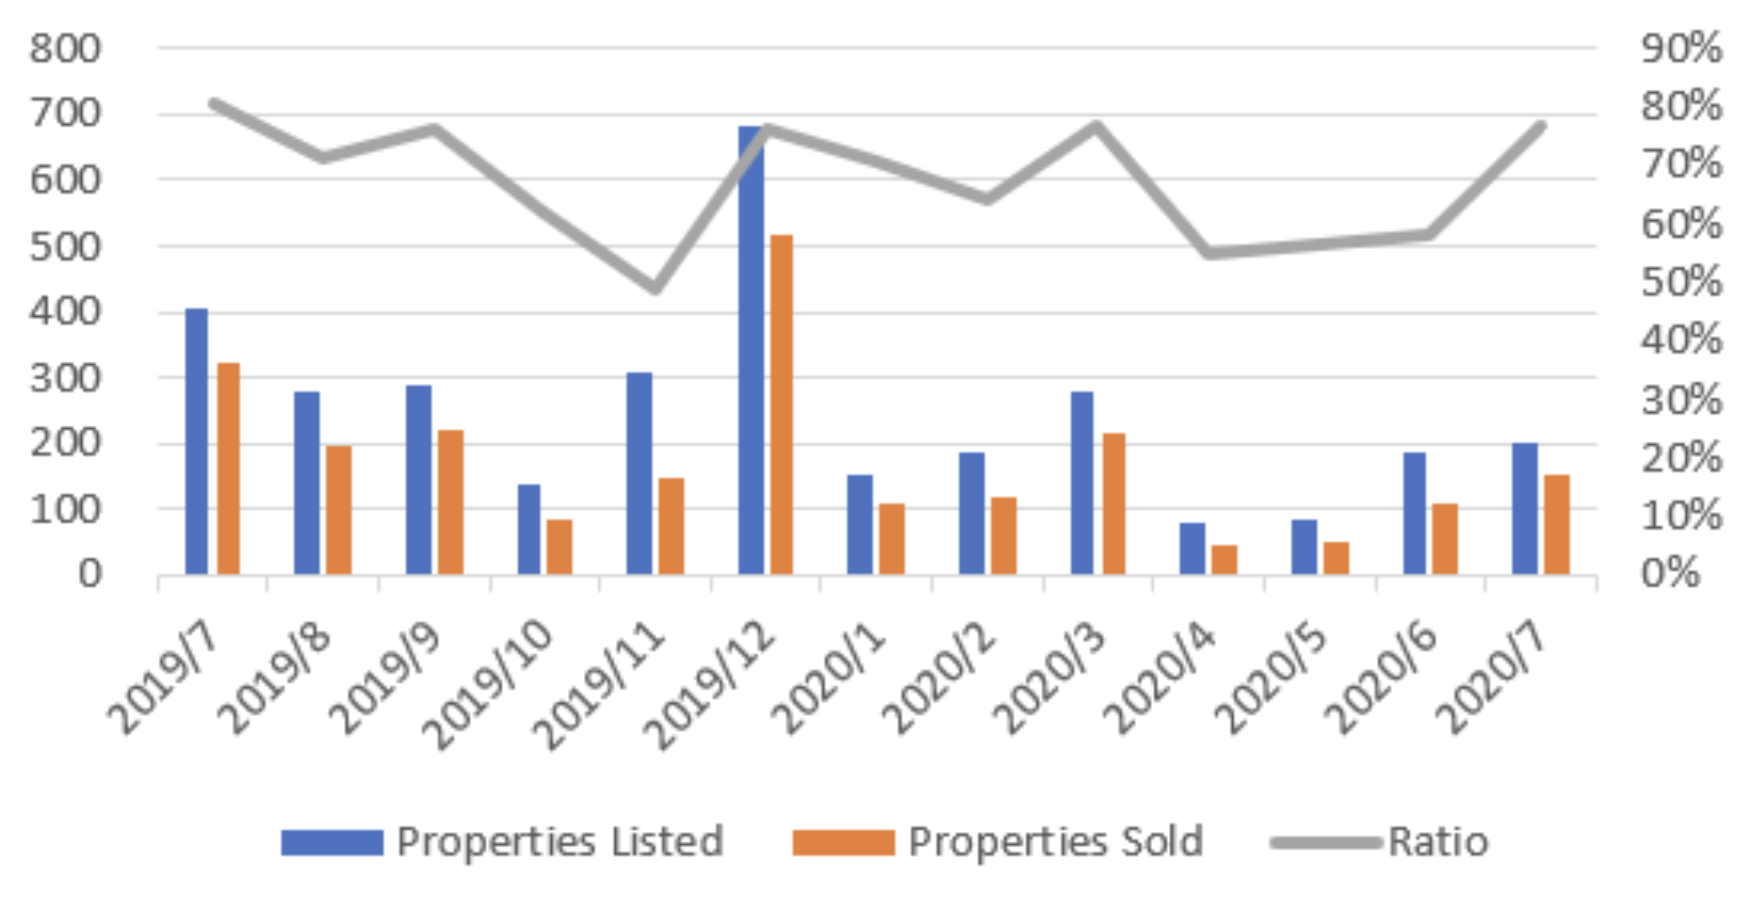
In the past year, Osaka Prefecture has launched an average of about 250 new properties per month. Under the effects of Covid-19, it has dropped to 100 in April and May 2020. Compared with the 404 households in the same period of the previous year, the 201 households in July 2020 have decreased by 50%. The signing ratio in the month of the launch reached a high level of about 80%.
Figure 5-1 Osaka Prefecture New Properties Supply and Demand
b. New Properties Price
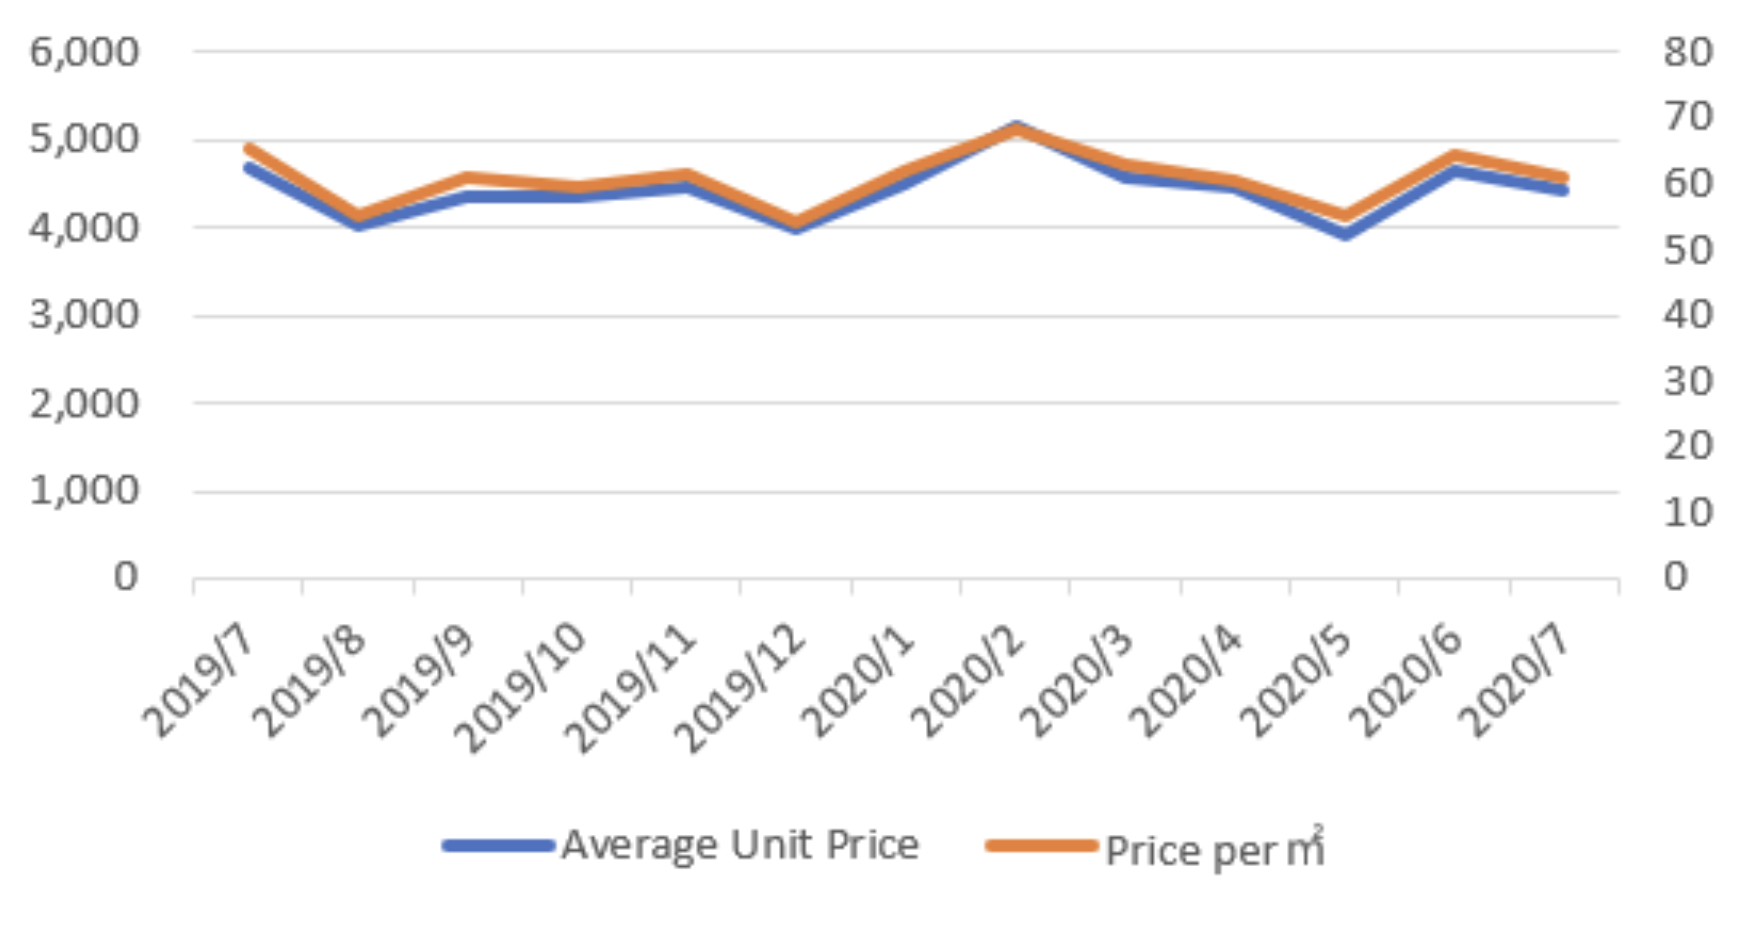
In the past year, the average price of a new properties in Osaka Prefecture was around JPY 44 million. In July 2020, it was JPY 44.12 million, a decrease of 5% compared to the same period last year. The average unit price per square meter in the past year was JPY 600,000, but it was JPY 610,000 in July 2020, which is almost the same as last year.
Figure 5-2 Osaka Prefecture Average Unit Price and Price per Squared Meter
c. Price Bands
Looking at the price of new home contracts in Osaka Prefecture, the highest band is between JPY 25 million and JPY 60 million. July 2020 and the same period last year have not changed much.
Figure 5-3 Osaka Prefecture Price Bands
Generally speaking, due to the Covid-19 state of emergency declaration, the numbers of new properties listed and sold in April and May of 2020 dropped significantly but it recovered in June. It is also clear that the price has not fallen sharply.
In this issue, we investigated the number of new properties listed vs number of properties sold, changes in selling prices, and various price bands based on public data.
We will continue to share objective data with you, hoping to make it your reference for Japanese properties.
[Disclaimer]
This article contains the author’s personal opinions, and if you have any questions or concerns about this article, please contact the author for further information. This article is not intended as a solicitation or recommendation to buy or sell any kind of investment, nor is it a suggestion or guarantee of any investment results or investment returns. The Company shall not be liable for any loss or damage caused based on this article.
