東京23区中古マンションの利回りトップ10(2020年)
目次
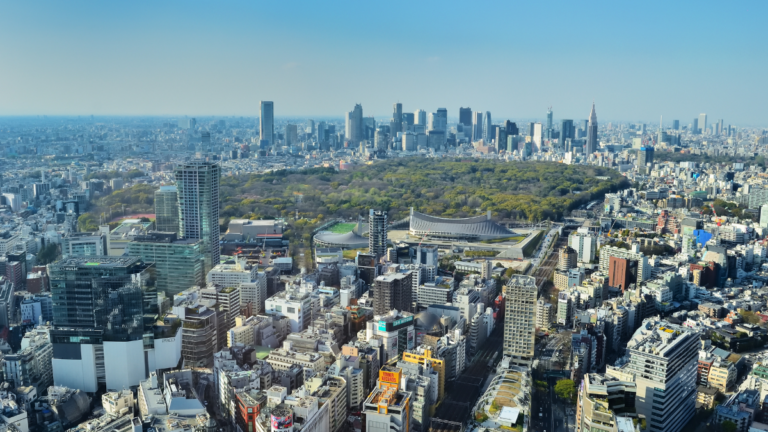
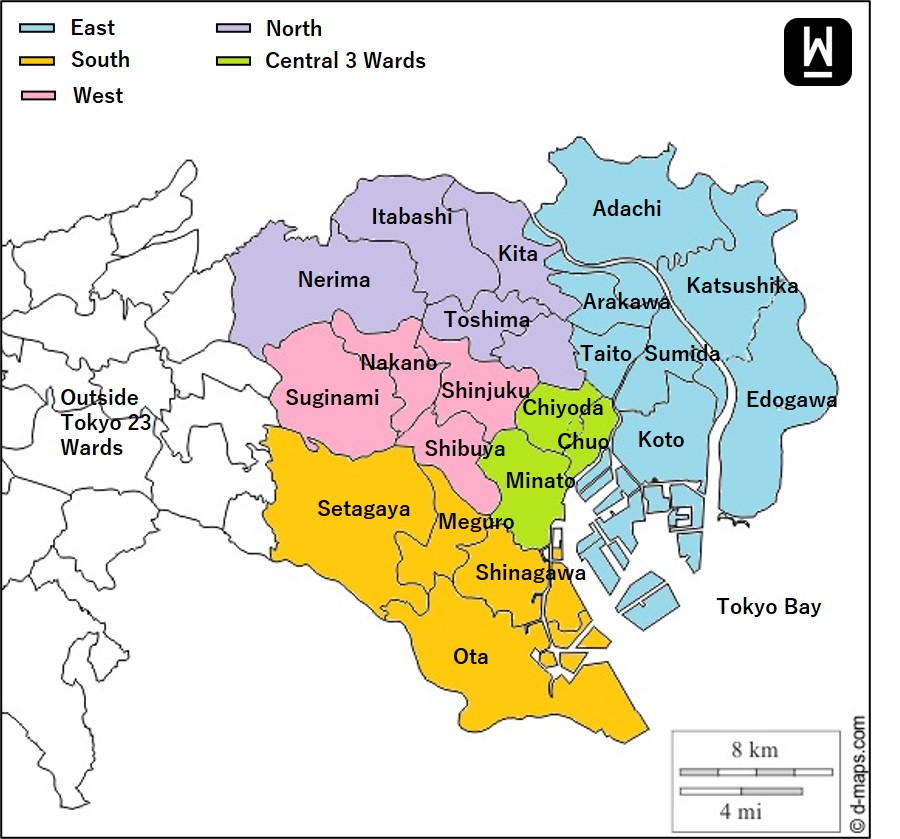
About Tokyo 23 Wards
There are 23 special wards in Tokyo, also known as Tokyo 23 wards. According to the 2020 Tokyo Population Census, special wards with larger populations include Setagaya (~940,000), Nerima (~740,000), Ota (~740,000), Edogawa (~690,000), and Adachi (~680,000). On the other hand Chiyoda (~67,000), Chuo (~170,000), Taito (~210,000), and Arakawa (~220,000) are special wards with a small population.
As shown on the following map, Tokyo 23 wards can also be further grouped by five submarkets (Central 3 wards, East, South, West, and North).
Top 3 Wards With Highest Rental Yield Are All In The East
According to our analysis of the existing property market in Tokyo 23 wards from January to December 2020*, the overall gross rental yield was 4.22%, a slight decrease of 0.1 percentage points compared to the same period last year. The top three rental yields by wards were Edogawa (5.17%), Adachi (5.03%), and Katsushika (4.84%), all of which are in the East. Together with Arakawa (4.48%), Koto (4.48%), and Sumida (4.26%), 6 of the top 10 wards belong to the East submarket. The remaining 4 are Setagaya (4.36%) in the South, Chuo (4.34%) in the City Centre, Itabashi (4.65%), and Kita (4.36%) in the North.
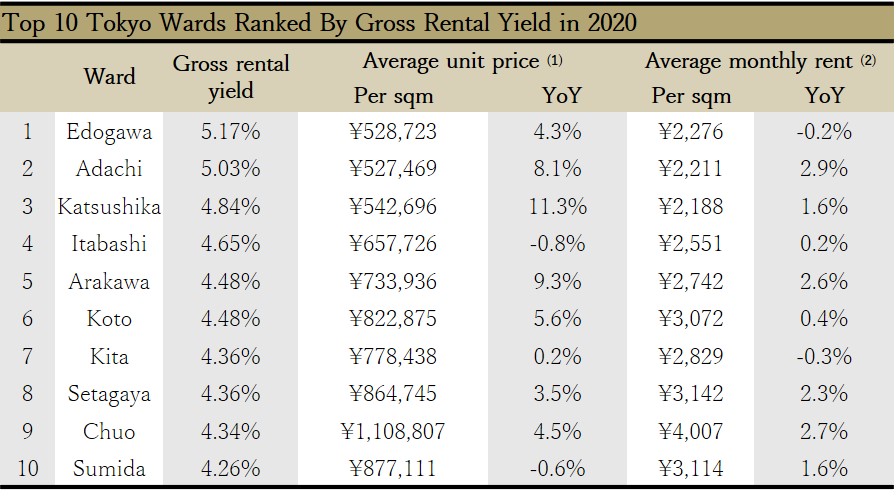 Source: WealthPark
(1) Average unit price of existing properties and its year-on-year growth rates are calculated based on the real estate sales transaction data from the Ministry of Land, Infrastructure, Transport and Tourism
(2) Average monthly rent of existing properties and its year-on-year growth rate are calculated based on the real estate rental transaction data in the Tokyo metropolitan area provided by Real Estate Information Network for East Japan
*The prices, rents, and rental yields of existing properties vary according to the location, age, size and condition, and other factors of the properties. The above statistics are for reference only.
High Price Growth In The East; Rents Also Increased
The average unit price of existing properties in Tokyo 23 wards as a whole was around JPY900,000 per square meter in 2020, an increase of 3.6% year-on-year, while the average monthly rent was around JPY3,200 per square meter, an increase of 1.3% year-on-year.
As shown in the table above, the wards with higher year-on-year growth in average unit prices were all in the East, including Katsushika (+11.3%), Arakawa (+9.3%), Adachi (+8.1%), and Koto (+5.6%). In particular, average monthly rents in Arakawa and Arakawa also increased at higher rates by 2.9% and 2.6% respectively.
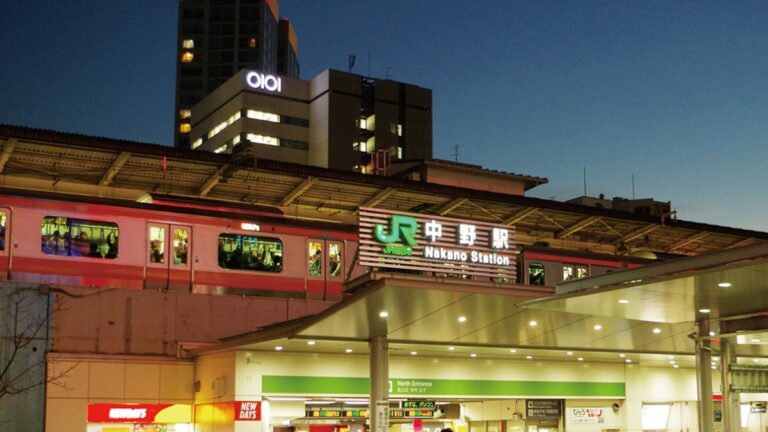
The East consists of areas with characteristics of “Shitamachi” and areas under development along the Tokyo Bay. “Shitamachi” refers to where the lower classes lived during the Edo period back then. Despite the convenience, lower cost of living, and easy access to the commercial areas around Tokyo Station (such as Otemachi, Marunouchi and Nihonbashi) , property prices and rents in the East are still low compared to other submarkets. That likely led to the increasing demand for housing in the East. In terms of busy stations in the East, besides well-known ones such as Akihabara and Ueno, there are also Ayase and Kitasenju in Adachi, Nippori in Arakawa, and Monzen Nakamachi in Koto etc.
Regarding wards in other submarkets, the average unit price in Chuo, Shinagawa, Shibuya, and Shinjuku, where the average price per square meter is over JPY1 million, rose by more than 4% year-on-year. Rents in Chiyoda and Minato fell by 1.5% and 0.5% year-on-year respectively. Due to the pandemic, some tenants might have chosen to work remotely and live outside the city centre where rents were cheaper. Otemachi in Chiyoda and Shinagawa in Minato are both Tokyo’s representative commercial areas. It is also worth noting that in Chuo, which is also a part of the city centre, besides the increase in its property price, its rent also rose by 2.7% year-on-year. This probably implies the optimism of the asset value of the Tokyo Olympic Athletes’ Village in Chuo.
Next, we will introduce the living environment and further look into the existing property market performance by property age and size in Tokyo 23 wards with high rental yields and increasing property prices to explore property investment opportunities in various parts of Tokyo!
—
WealthPark is a real estate technology company that provides online and offline management services for overseas investors who own properties in major cities of Japan, including Tokyo, Osaka, Nagoya, Fukuoka, and Sapporo. WealthPark closely cooperates with real estate brokers and technology companies in order to provide investors with comprehensive asset management and property transaction services. WealthPark will continue to expand its digital platform to create and improve user experience.
Contact Us:
https://wealth-park.com/en/corporate/contact/wp-am/